Fig. 6.

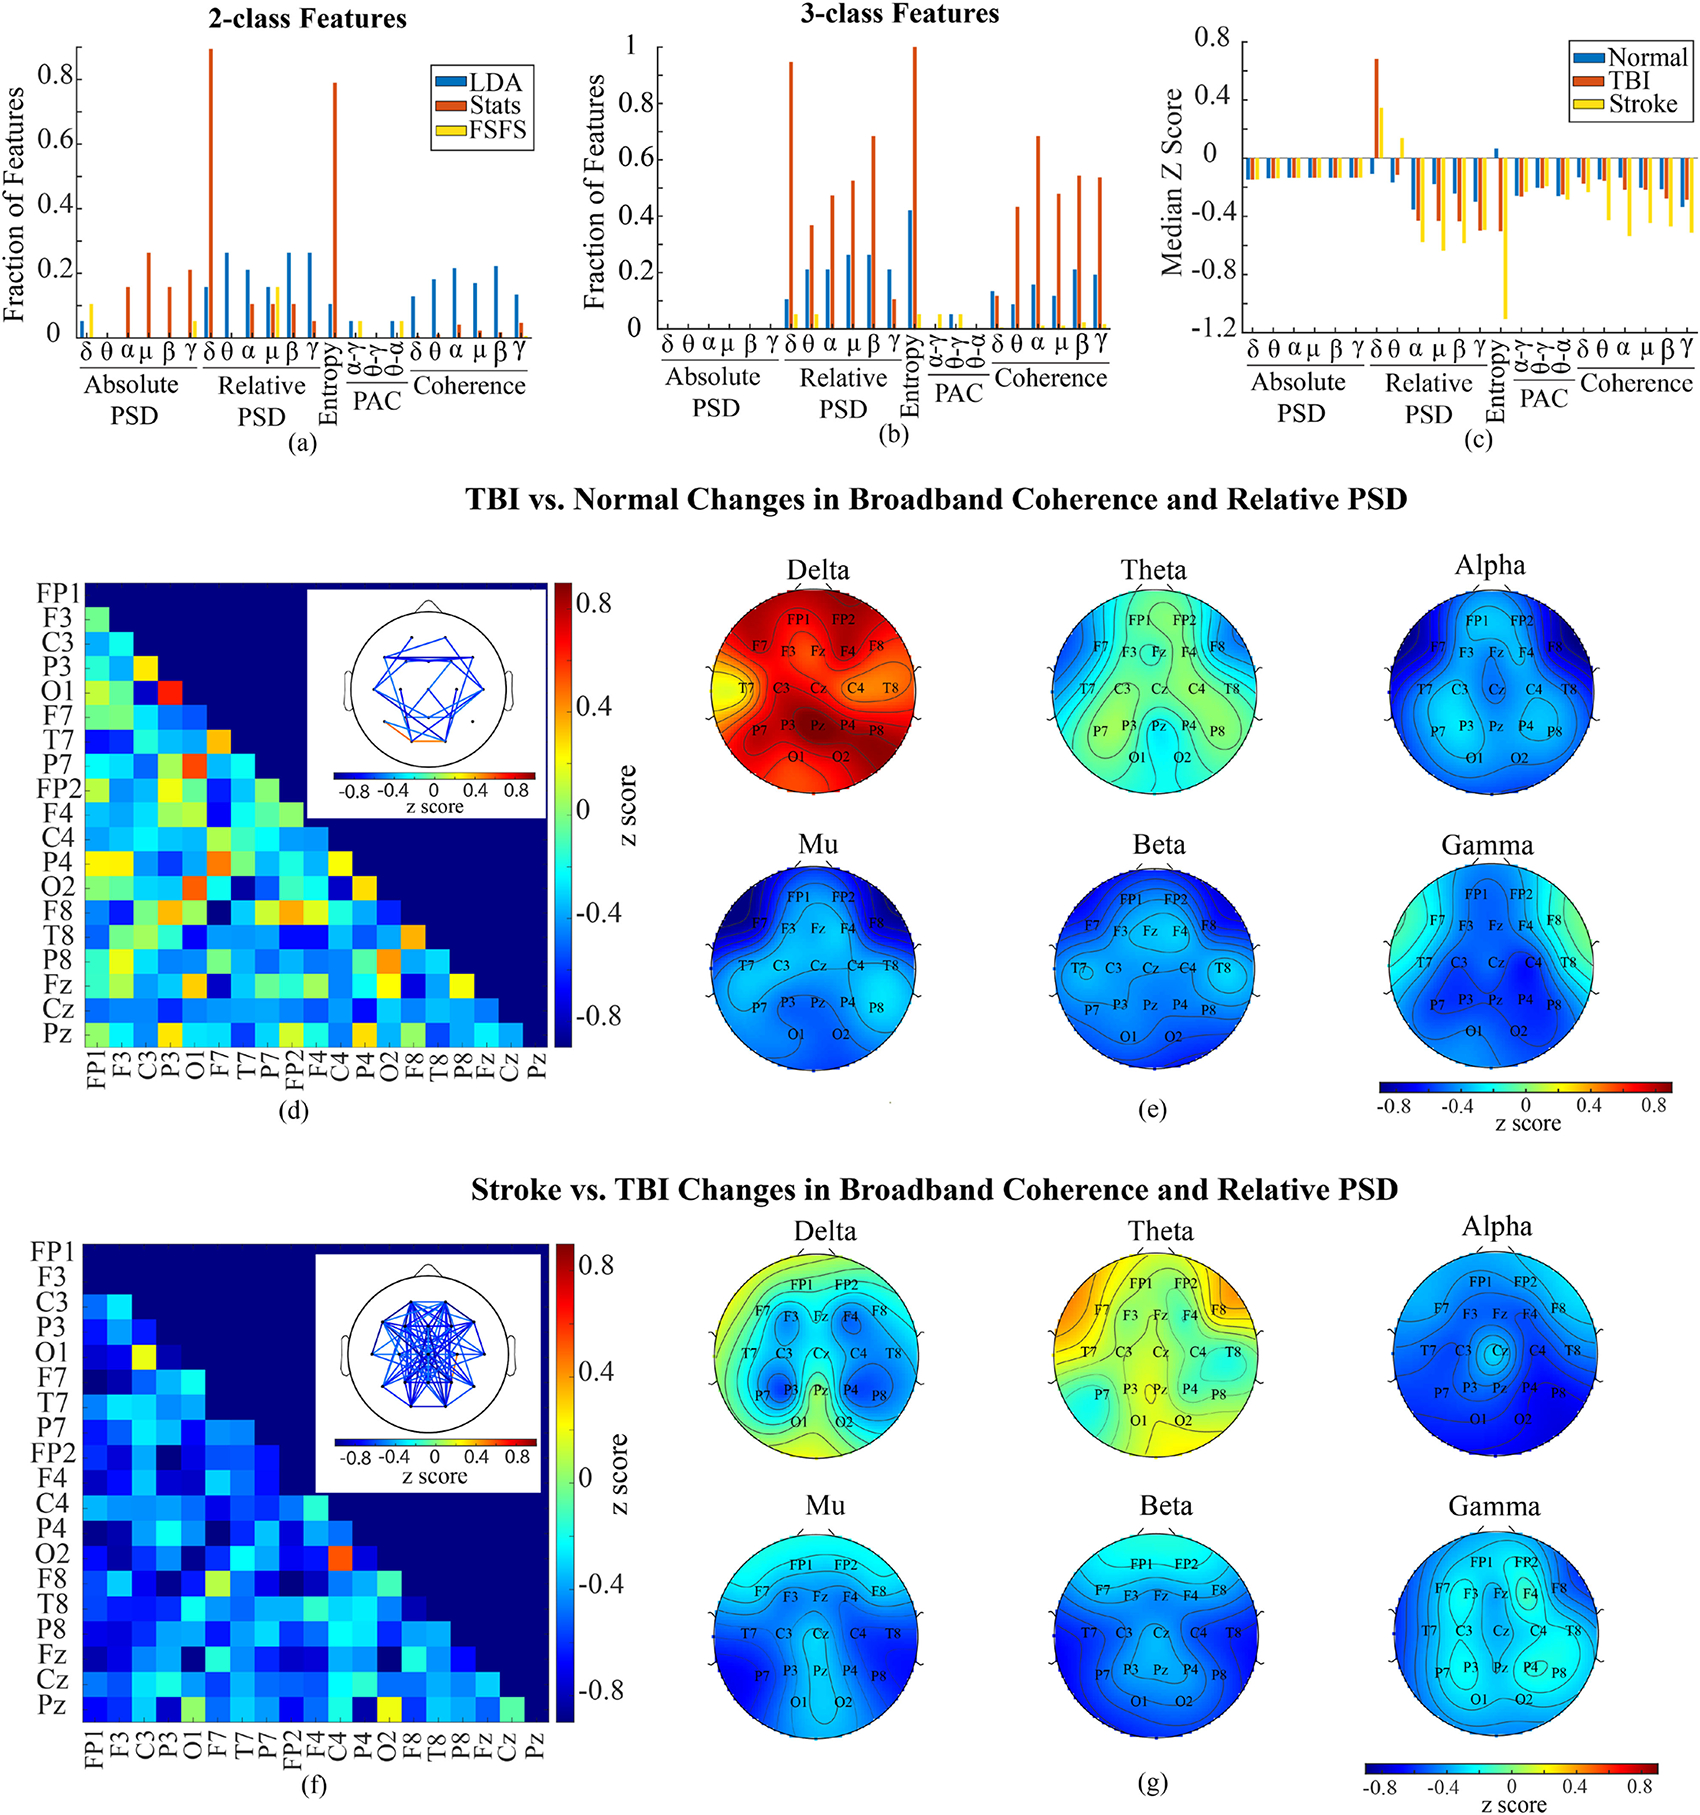
Changes in clean EEG features. (a) shows the fraction of features selected by statistics, LDA, and FSFS out of total number of features in each type of features (i.e., 171 coherence and 19 relative PSD features in each frequency band) without consideration of channels for 2-class classification. (b) shows the fraction of selected features for 3-class classification. (c) shows the median z score for each type of features in normal, TBI and stroke subjects respectively. (d) shows the broadband coherence change from normal to TBI. Main panel shows the median z score of coherence coefficients of all channel pairs. Inset demonstrates the channel pairs with median z score higher than 0.5 or lower than −0.5. (e) shows the topographic map of relative PSD based on z scores. (f) indicates the z score of stroke broadband coherence to TBI. Inset shows the channel pairs with median z score higher than 0.5 or lower than −0.5. (g) shows the topographic map of relative PSD z score of stroke subjects to TBI. (LDA: linear discriminant analysis, FSFS: forward sequential feature selection, Stats: statistics, PAC: phase-amplitude coupling, PSD: power spectral density).
