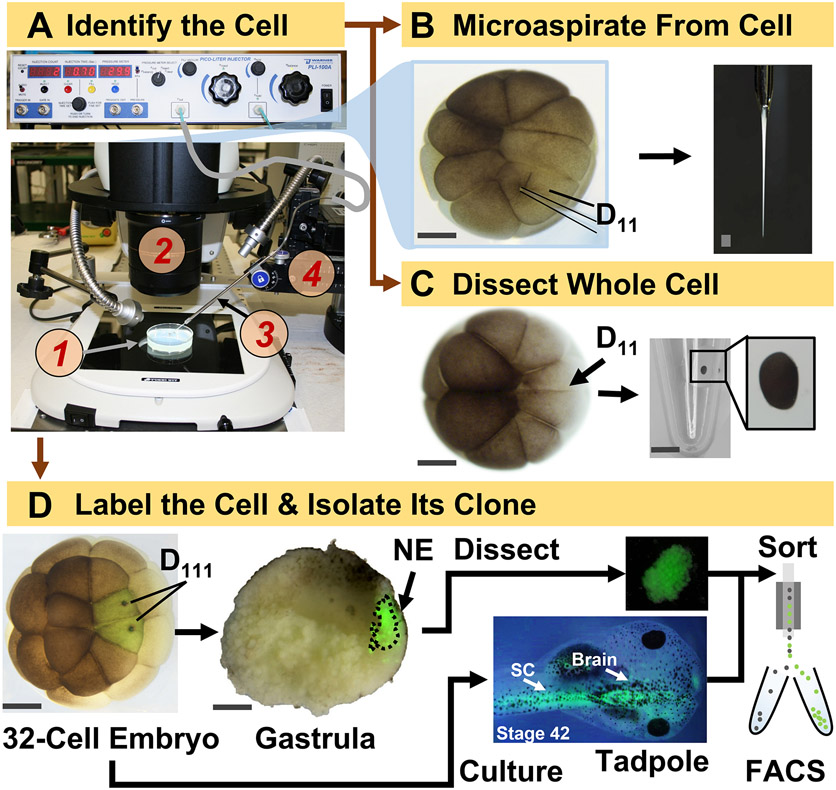
Figure 1: Spatiotemporally scalable proteomics enabling cell-lineage guided HRMS proteomics in the developing (frog) embryo.
(A) Visualization of the specimen (1) using a stereomicroscope (2) for injection of an identified cell (inset), using a micropipette (3) under control by a translation-stage (4). (B) Subcellular sampling of the identified left D11 cell in a 16-cell embryo. (C) Dissection of a whole D11 cell from a 16-cell embryo. (D) Fluorescent (green) tracing of the left and right D111 progenies from a 32-cell embryo to guide dissection of the neural ectoderm (NE) in the gastrula (stage 10) and isolation of the descendent tissue from the tadpole using FACS. Scale bars: 200 μm for embryos, 1.25 mm forthe vial. Figures were adapted with permission from references15,19,21,59.

