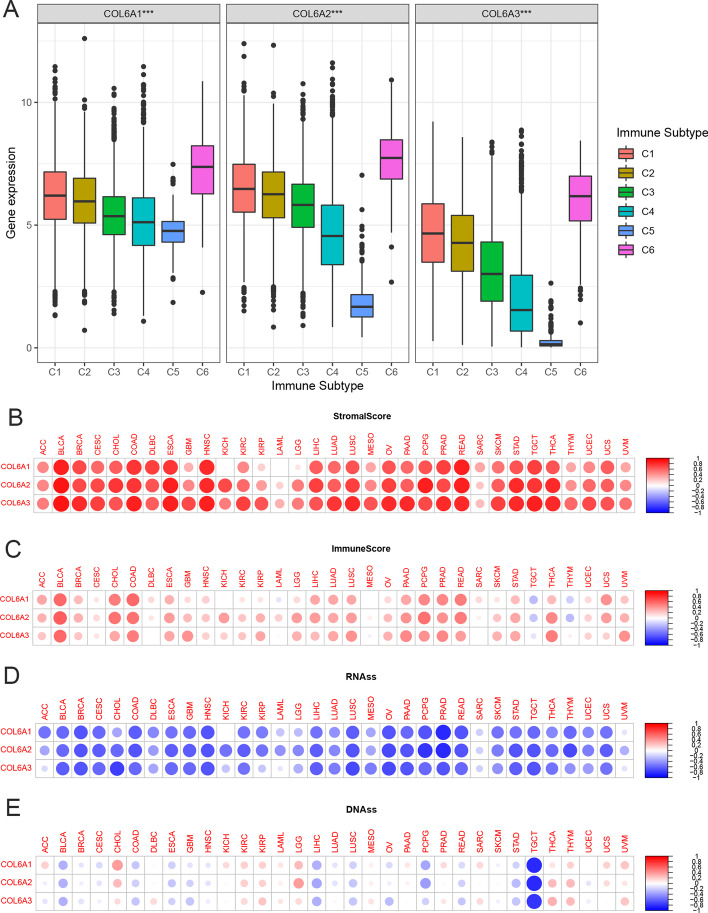
Fig. 3.
Association of collagen VI Family associated with immune subtypes, tumor microenvironment, and stemness scores in pan-cancer. A COL6A gene expression levels in C1-C6 immune subtypes. C1, wound healing; C2, IFN-γ dominant; C3, inflammatory; C4, lymphocyte depleted; C5, immunologically quiet; C6, TGF-β dominant. *p < 0.05; **p < 0.01; ***p < 0.001. B–C The two heatmaps of the association of COL6A gene expression with stromal scores and immune scores in different cancers, respectively. D–E The two heatmaps of the association of COL6A gene expression with RNAss and DNAss in different cancers, respectively. Red dots represent positive correlation, while blue dots represent negative correlation, and the darker the color, the greater the absolute value of the correlation coefficient. The size of the dots represents statistical significance. RNAss: RNA-based stemness scores; DNAss: DNA methylation-based stemness scores

