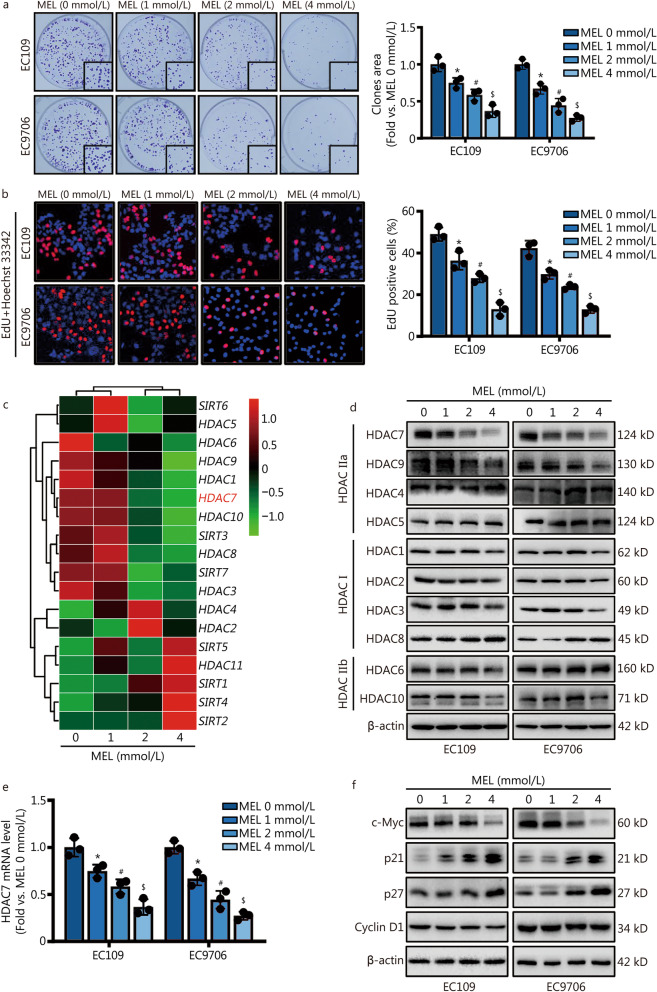
Fig. 1.
Melatonin induces cell proliferation inhibition, HDAC7 and c-Myc downregulation on ESCC cells. a Colony formation assay with melatonin pretreatments for 48 h. b Representative images and results of EdU incorporation assay. The result was calculated as the ratio between the number of EdU-stained cells (red fluorescence) and the total number of Hoechst 33342-stained cells (blue fluorescence). c Representative heatmap of HDACs gene expression based on the RNA‐seq results of EC109 cells. d Representative Western blotting results of HDACs. e Representative result of HDAC7 mRNA level. f Representative Western blotting results of c-Myc, p21, p27 and Cyclin D1. *P < 0.05 vs. the MEL 0 mmol/L group, #P < 0.05 vs. the MEL 1 mmol/L group, $P < 0.05 vs. the MEL 2 mmol/L group. HDAC7 histone deacetylase 7, ESCC esophageal squamous cell carcinoma, MEL melatonin

