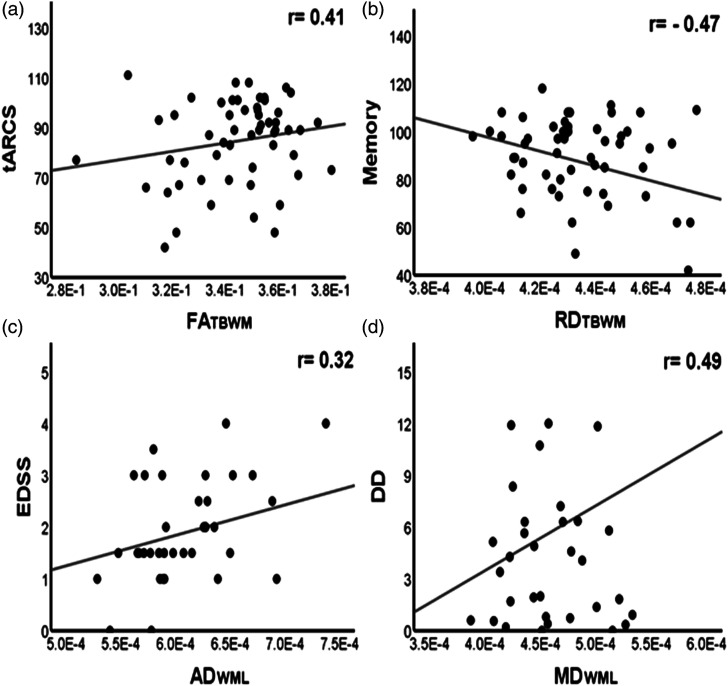
Figure 1.
Scatter plots showing some significant correlations: (a) FATBWM with tARCS (r = 0.41), (b) RDTBWM with Memory (r = −0.47), (c) ADWML with EDSS (r = 0.32) and (d) MDWML with DD (r = 0.49). FA: fractional anisotropy; RD: radial diffusivity; AD: axial diffusivity; MD: mean diffusivity; TBWM: total brain white matter; WML: white matter lesion; tARCS: total audio recorded cognitive screen; EDSS: expanded disability status scale; DD: disease duration. FATBWM is unitless, while RDTBWM, ADWML and MDWML are in mm 2 /s.

