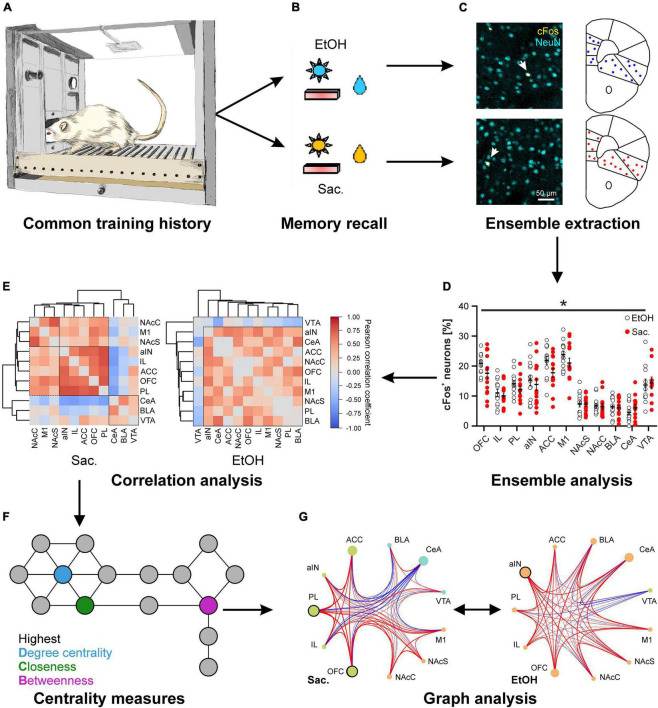
FIGURE 1.
Distinct cue-reward memories are encoded by specific meta-ensembles consisting of co-active neuronal ensembles spread across multiple brain regions. Rats trained on a concurrent 2-reward operant self-administration paradigm establish memories for both rewards (A) that are retrieved under reinstatement conditions, meaning that previously learned reward-specific cues are presented but seeking behavior is not rewarded (B). (C,D) Postmortem cFos expression analysis allows the analysis of neuronal ensembles within distinct brain areas. (C) Representative images of immuno double-labeling of cFos and the pan-neuronal marker NeuN, to determine the fraction of activated neurons, in the central amygdala after reinstatement for alcohol (top) and saccharin (bottom). (D) Quantification of the fraction of cFos labeled, activated neurons in 10 different reward-related brain regions after reinstatement for either alcohol (EtOH, white circles) or saccharin (Sac., red circles) (Data is presented as mean ± s.e.m., *p < 0.05, two-way ANOVA, main effect of group). (E–G) Reward-specific properties of brain activity are only evident after analysis of co-activity across brain regions (E) and subsequent graph theory-based analyses (G) such as analyses of centrality measures (F). (E) Hierarchical clustering of brain regions according to the Pearson correlation coefficients derived from the fraction of cFos labeled neurons after reinstatement for saccharin (Sac., left) or alcohol (EtOH, right). (F) Scheme illustrating three commonly used centrality measures to analyze networks. The degree centrality is defined as the number of nodes directly connected to the node of interest. The closeness and betweenness are measures for the distance from the node of interest to all other nodes and the number of shortest connections between all other nodes that run via the node of interest, respectively. That means, nodes with a high degree centrality have many direct neighbors while those with a high closeness are at short distance to many other nodes. A high betweenness on the other hand indicates that a lot of (short) connections between other nodes, and thus information, run via the node of interest. (G) Example for the analysis of networks derived from the fractions of cFos labeled neurons after reinstatement for saccharin (Sac., left) and alcohol (EtOH, right) showing the recruited meta-ensembles. The size of the circles represents the importance of the brain region in information flow derived from centrality analysis and the strength and color of the connecting lines represents properties of network edges based on the Pearson correlation coefficients (thicker lines = stronger correlation, red: positive correlation, blue: negative correlation). Brain region labels: ACC, anterior cingulate cortex; aIN, anterior insular cortex; BLA, basolateral amygdala; CeA, central amygdala; IL, infralimbic cortex; M1, primary motor cortex; NAcC, nucleus accumbens core; NAcS, nucleus accumbens shell; OFC, orbitofrontal cortex; PL, prelimbic cortex; VTA, ventral tegmental area. [cFos staining in panel (C) as well as panels (D–G) reproduced from Wandres et al. (2021)].

