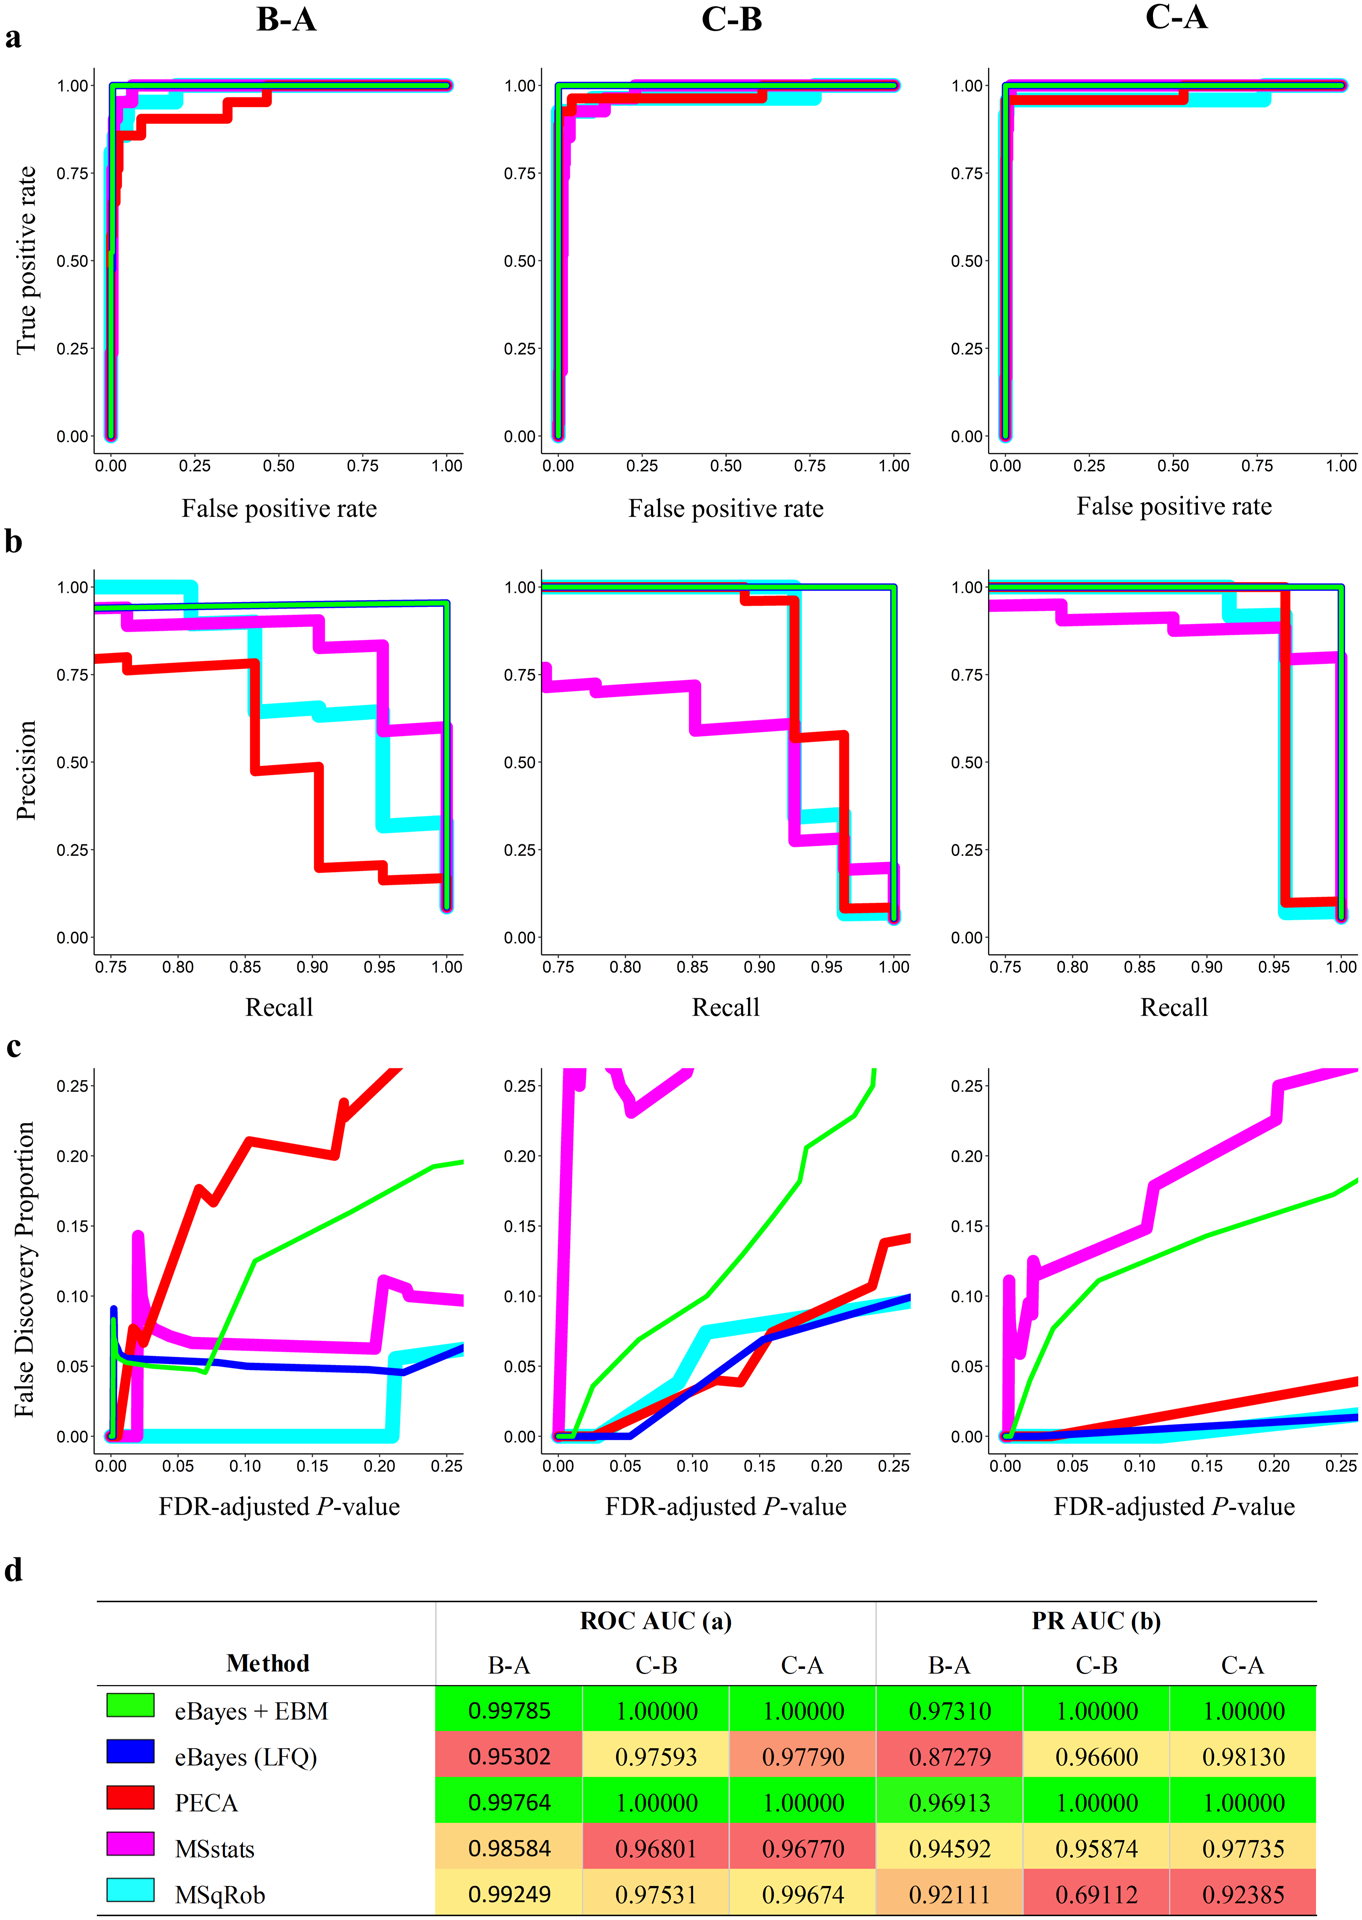
Figure 2.

Comparison of methods for detecting differentially abundant proteins using (a) ROC curves, (b) PR curves, (c) FDP vs. predicted FDR-adjusted P-values, and (d) corresponding ROC and PR AUC values for each sample comparison. Colored lines (a, b, c) indicate the different methods compared for detection of spike in proteins as indicated in (d). Differences in line thickness are for visual aid only. Gradient coloring in (d) is specific to each sample comparison and method with green coloring indicating the highest AUC and red the lowest. Note that the axes for each metric (a-c) vary in range.
