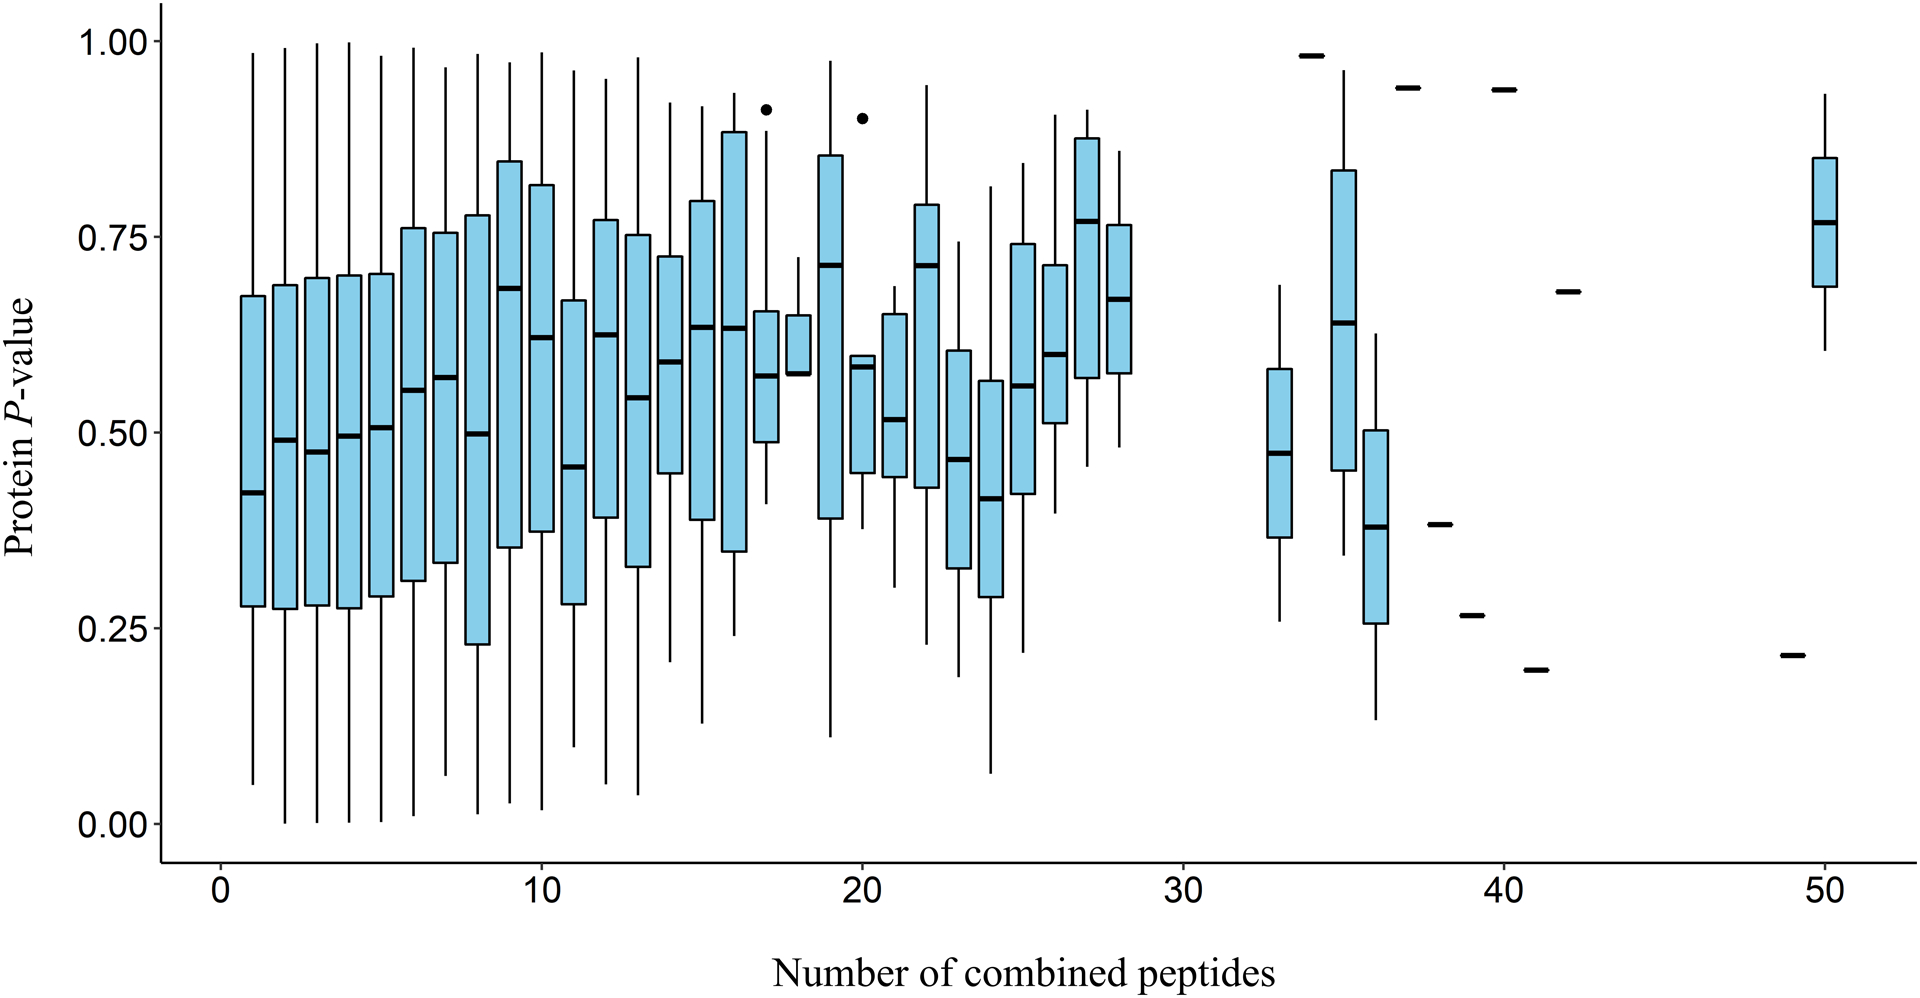
Figure 3.

Boxplots of protein level P-value distributions produced by EBM combination for varying numbers of combined peptides for all yeast proteins across all comparisons. Missing boxplots indicate a lack of proteins detected with the specified number of peptides. Single horizontal lines outside of a boxplot indicate the P-value of a single analyzed protein.
