FIGURE 4.

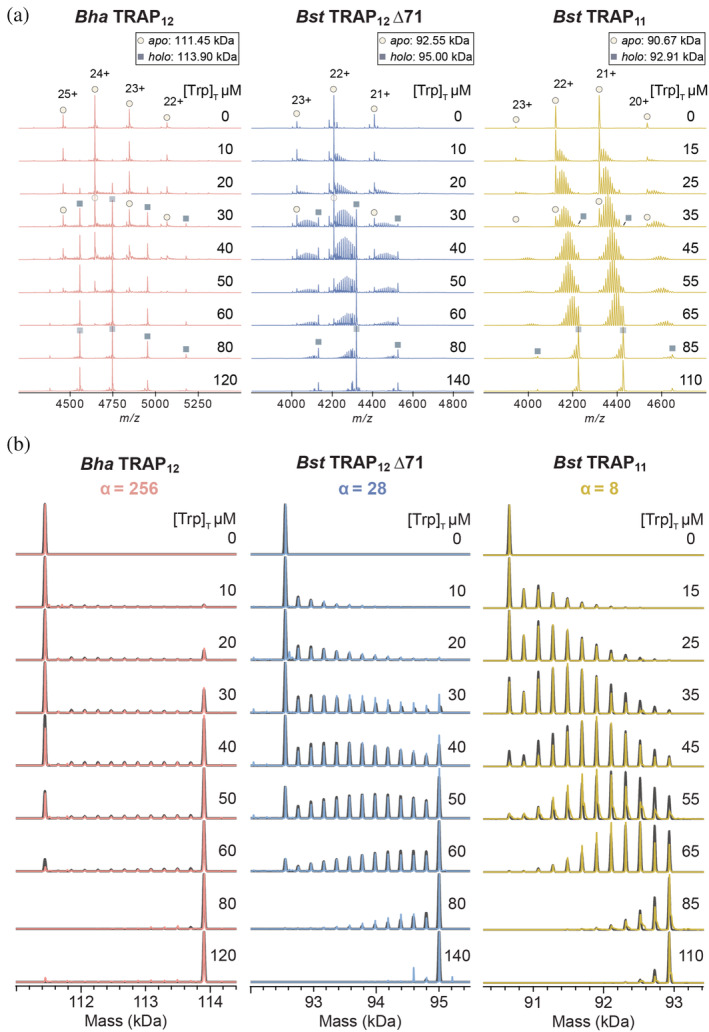
Population distributions measured by native MS reveal extents of homotropic cooperativity in ligand binding to 12mer Bha and Bst Δ71 TRAP (left, middle), and 11mer wild‐type Bst TRAP (right). (a) Native mass spectra of the three TRAP oligomers (6.0–7.4 μM; Table S3) titrated with 0–140 μM Trp. Increasing Trp in each titration shifts the Trp n ‐TRAP populations from apo (Trp0, circles) to holo (Trp11/12, squares). Each Trp titration set with either Bha TRAP12 (left), Bst TRAP12 Δ71 (middle), or Bst TRAP11 (right) features different population distributions, reflecting different degrees of cooperativity. (b) Deconvolved zero‐charge mass spectra for the three TRAP oligomers: Bha TRAP12 (left), Bst TRAP12 ∆71 (middle), or Bst TRAP11 (right). Each experimental dataset (colored) is superimposed with a simulated mass spectrum obtained from best‐fit parameters to the nearest‐neighbor model (grey). Cooperativity is quantified by the parameter α, which is the ratio of the association constant for binding to sites with one bound neighbor, and no bound neighbors (K N1/K 0; Figure 2a). Bha TRAP12 (left) shows the strongest cooperativity (α = 256, 1/K 0 = 718 μM), with populations dominated by apo and holo rings. Cooperativity is moderate (α = 28, 1/K 0 = 217 μM) in Bst TRAP12 Δ71 (middle) and weak (α = 8, 1/K 0 = 36 μM) in Bst TRAP11 (right).TRAP, trp RNA‐binding attenuation protein
