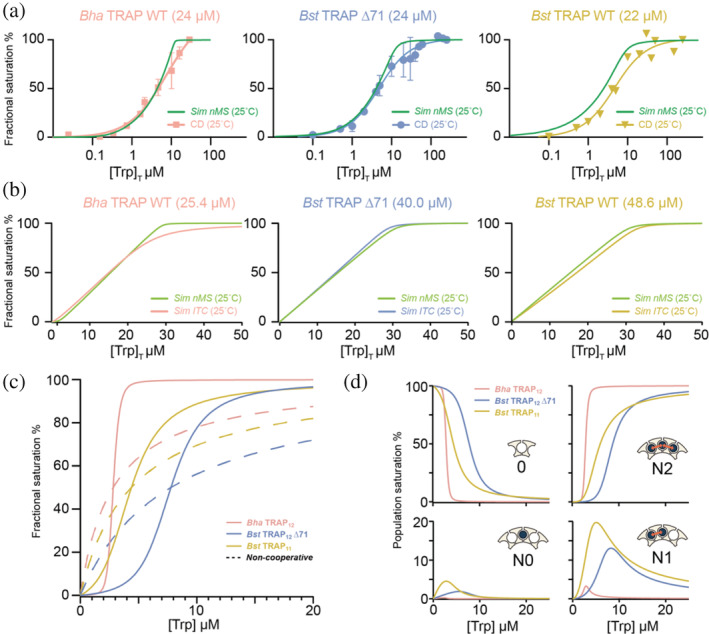
FIGURE 5.

Prediction of macroscopic behavior from microscopic parameters from the NN cooperativity model. (a) Simulated native MS bound fraction from nearest‐neighbor parameters (green) and experimental CD signal change (at 228 nm) at the indicated Trp‐binding site concentrations. (b) Simulated native MS bound fraction nearest‐neighbor parameters (green) and computed ITC fractional saturation curves based on phenomenological model parameters ΔG and n (Table S2). Simulations used thermodynamic parameters from native MS at room temperature, and temperature and concentrations used in CD and ITC experiments. (c) Simulated mean site occupancy of TRAP proteins over a range of ligand concentrations [Trp]. Bha TRAP12 (pink) features a sharp change from almost empty to near complete saturation over the range [Trp] of 2–3 μM. Bst TRAP11 (yellow) and Bst TRAP12 ∆71 (blue) have more gradual saturation curves due to their weaker cooperativity. Saturation curves with the same apparent K D values in the absence of Trp‐Trp cooperativity are shown by dashed lines. (d) Population evolution for the four distinct nearest neighbor binding configurations as a function of [Trp]: (1) empty sites (0), (2) bound sites with no bound neighbors (N0), (3) bound sites with one bound neighbor (N1), and (4) bounds sites with two bound neighbors (N2). The strong cooperativity in Bha TRAP12 (pink) makes N2 the most dominant bound configuration through the range of concentrations. Weaker cooperativity in Bst TRAP11 (yellow) and Bst TRAP12 ∆71 (blue) allows significant populations of N0, N1, and N2 states over the concentration range. The concentration of populations with adjacent bound ligands can be understood to affect the protein's regulatory response. CD, circular dichroism; ITC, isothermal titration calorimetry; MS, mass spectrometry; TRAP, trp RNA‐binding attenuation protein
