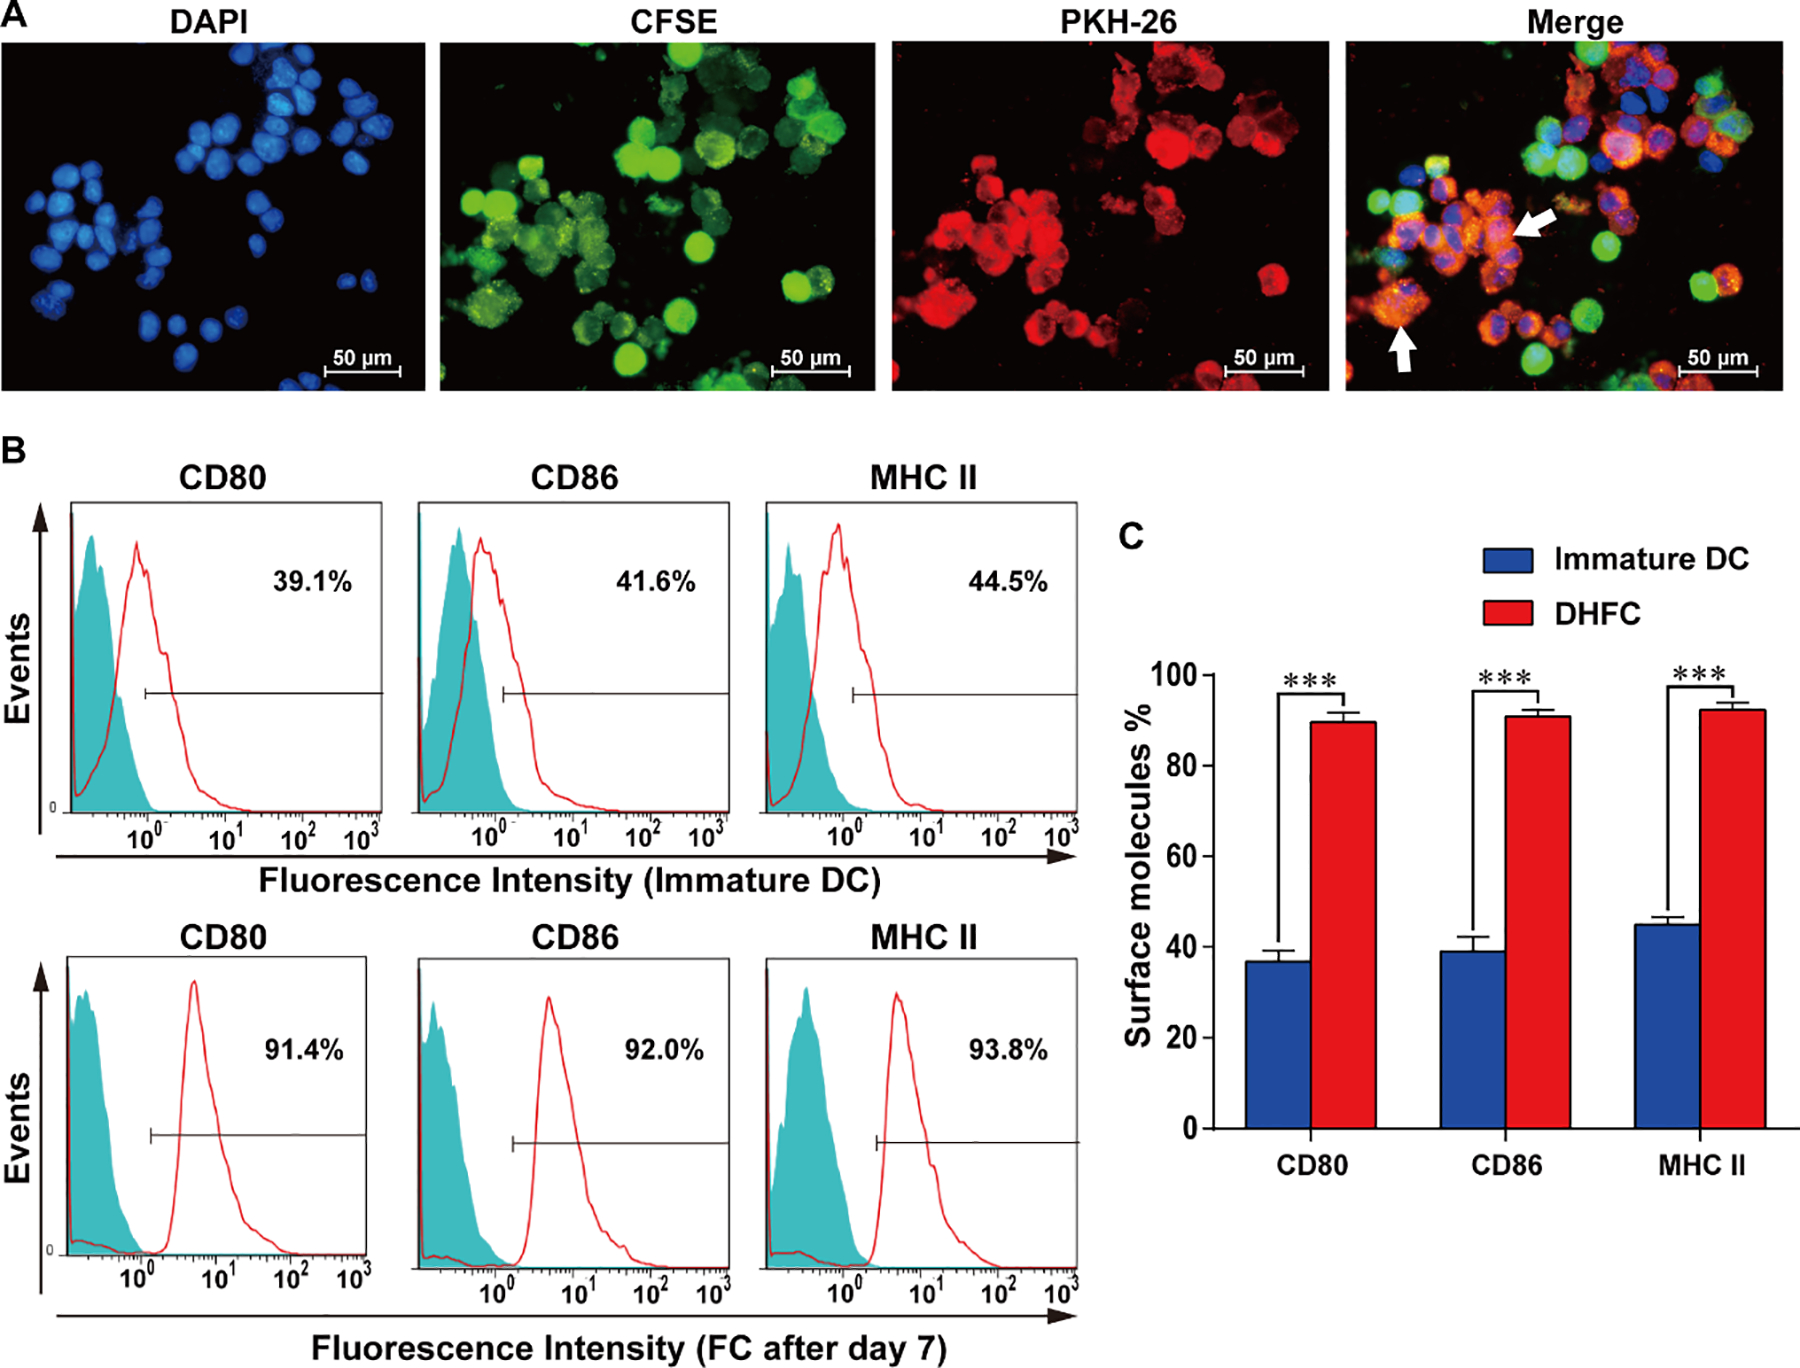
Figure 1. Identification of DC/HepG2 fusion cells and express increased CD80, CD86 and MHC II.

(A) The DC2.4/HepG2 fusion cell identification approach was as follows: CSFE (green) and PKH26 (red) were used for the respective labeling of DCs and HepG2 cells, after which PEG was used to mediate fusion. DAPI (blue) was then used for nuclear staining, followed by fluorescence microscopy with fused cells marked by white arrows (× 400). Images are representative of three independent experiments. (B) DCs exhibited MHC II and costimulatory molecule expression at day 7 in FCs. (C) The status of three membrane molecules, MHC II, CD80 and CD86 were high at day 7 in FCs. Data are means ± SD, n = 3. *** P < 0.001.
