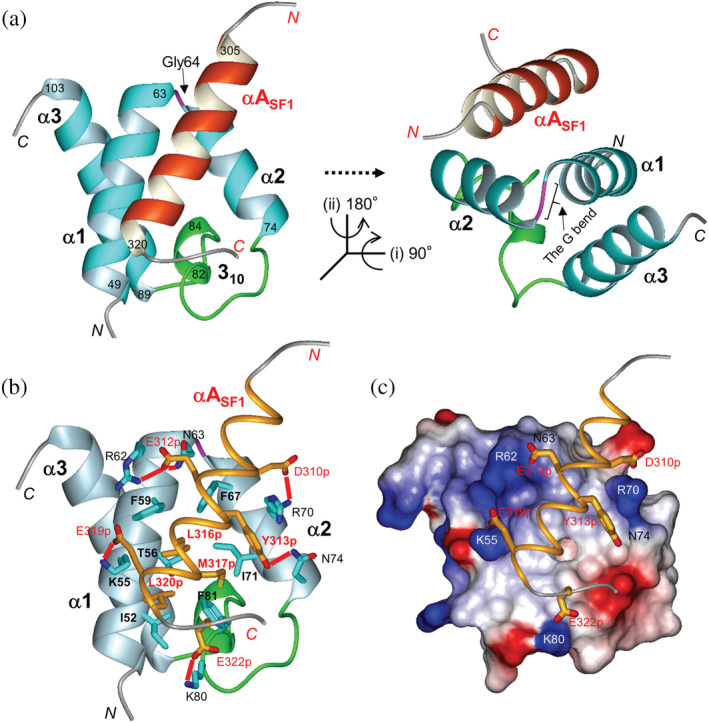
FIGURE 5.

The structure of SURP1 in complex with S1BR. (a) Ribbon representation of SURP1 (res. 48–105) in complex with S1BR (res. 302–324) in different views. The structure in the left panel is in the same orientation as that of Figure 3c. The structure in the right panel is rotated as directed. The α‐helices in SURP1 and S1BR are depicted in cyan and orange, respectively. The G bend, connecting α1 and α2, and the 310 loop, connecting α2 and α3, are depicted in magenta and green, respectively. (b) Interaction between SURP1 and S1BR. Structures of SURP1 and S1BR are shown in ribbon (light blue) and thin ribbon (orange) models, respectively. Residues involved in the complex formation are shown, as described in the text. Side chains of the residues are represented as follows: carbon, cyan (SURP1), or orange (S1BR); oxygen, red; nitrogen, blue; and sulfur, yellow. Salt bridges and hydrogen bonds between SURP1 and S1BR are represented by red lines. (c) The electrostatic potential surface of SURP1 in complex with S1BR. Red and blue indicate negative and positive charges, respectively. The representation code in S1BR is the same as that in (b). The view is in the same orientation as that in (b).
