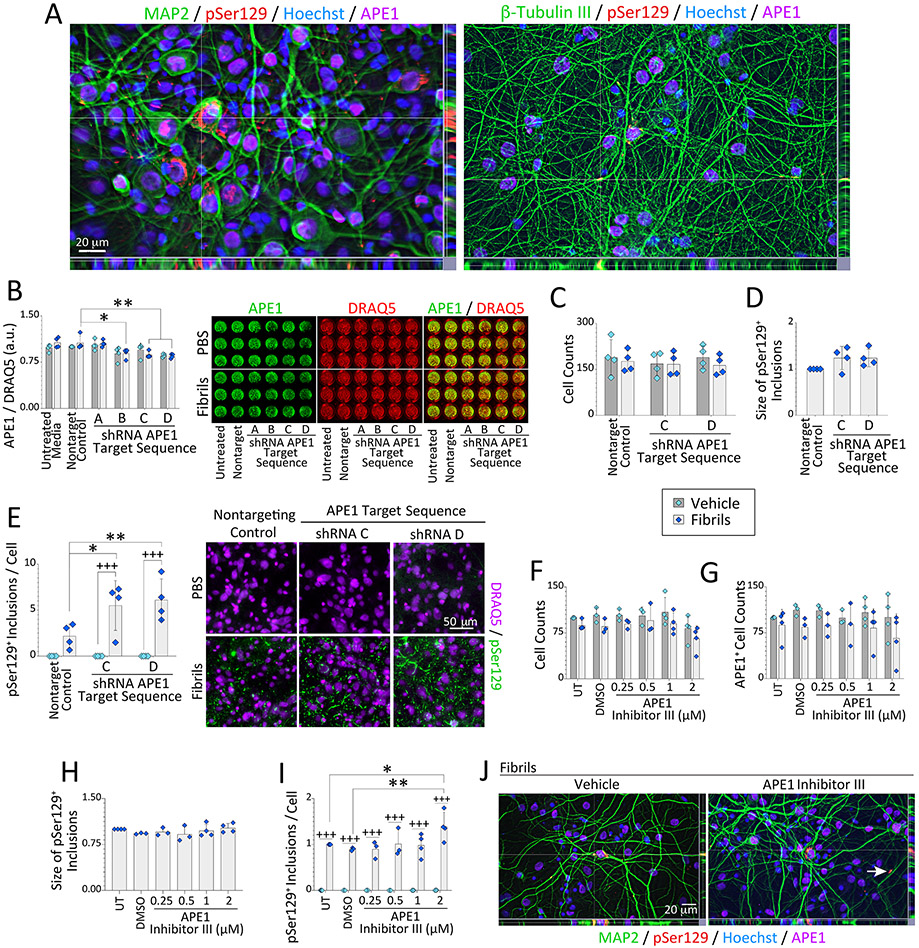
Figure 1. Loss of APE1 exacerbates α-synucleinopathy without cell loss.
(A) Primary hippocampal cultures were treated on day in vitro 2 (DIV2) with sonicated, preformed α-synuclein fibrils (1 μg/mL) and immunostained on DIV12 for somatodendritic neuron marker MAP2, neuronal process marker β-tubulin III, APE1, and phosphorylated α-synuclein (pSer129; also see Fig. S1-S2). Nuclei were stained with the Hoechst reagent. (B-E) Primary hippocampal cultures were treated on DIV2 with α-synuclein fibrils (1 μg/mL) and APE1-targeted shRNA by lentiviral delivery (60,000 transduction units per well in 96-well plates). Cells were fixed three days (B) or 10 days (C-E) after lentiviral exposure and stained for pan-nuclear markers DRAQ5 or Hoechst (also see Fig. S3-S5). (B) APE1 levels are shown as a fraction of DRAQ5+ nuclear staining on DIV5 via In-Cell Western analyses on a 16-bit, low resolution/high sensitivity infrared imager. (C-E) Microscopic quantification of DRAQ5+ cell counts, pSer129+ inclusion sizes (fold-change of nontargeting controls), and pSer129+ inclusion densities on DIV12 after APE1 knockdown. (F-J) Primary hippocampal cultures were treated on DIV2 with α-synuclein fibrils (1 μg/mL) and APE1 Inhibitor III. Cells were immunostained on DIV12 for pSer129 and APE1 (see Fig. S6). (F) Hoechst+ cell counts and (G) APE1+ cell counts as % of untreated controls. (H) pSer129+ inclusion size (fold-change of untreated controls). (I) pSer129+ inclusion counts as a fraction of Hoechst+ cell numbers (fold-change of untreated controls). (J) Subcellular localization of the inclusions was not changed by APE1 inhibitor III treatment (Fig. S1D for higher-resolution images and reference to white arrow). Data are shown as mean ± S.D. of 3-4 independent cultures. For B-I, two-way ANOVAs were followed by the Bonferroni post hoc (except D and H, which were analyzed with one-way ANOVA/Bonferroni). For B-E, *p≤0.05, **p≤0.01 shRNA vs. non-targeting lentivirus control; +++p≤0.001 vehicle vs. fibrils. For F-I, *p≤0.05, **p≤0.01 APE1 inhibitor III vs. untreated (UT) or DMSO controls; +++p≤0.001 vehicle vs. fibrils.

