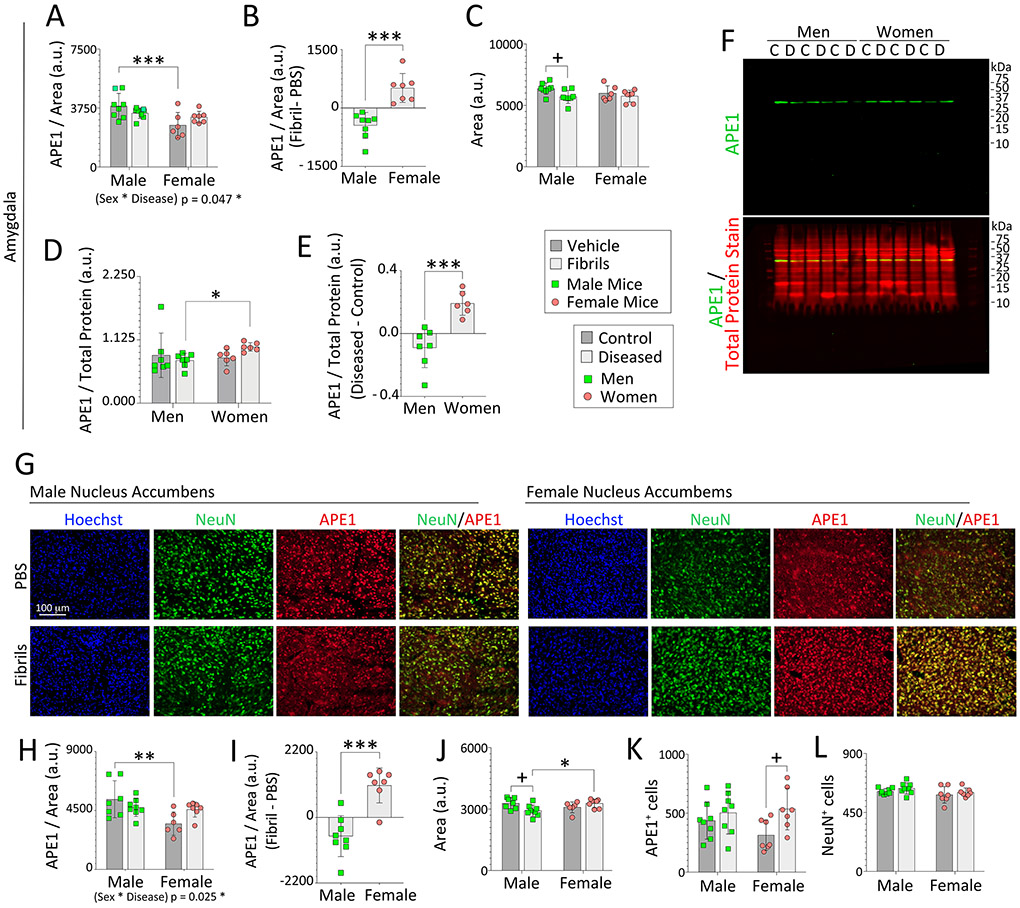
Figure 3. Impact of α-synucleinopathy on APE1 expression in the amygdala of mice and humans and in the mouse nucleus accumbens.
Three-month-old male and female mice were infused in the right OB/AON with sonicated α-synuclein fibrils (5 μg) or an equal volume of PBS (1 μL). Brain sections were cut in the sagittal plane after a six-month survival period and immunostained for APE1 or NeuN. Nuclei were labeled with Hoechst. A blinded observer analyzed APE1 expression levels and area of select regions by tracing the area of interest in the right hemisphere on scans captured with a 16 bit-depth, low-resolution imager (images in Fig. 2A). APE1 levels per unit area in traces of the mouse (A) amygdala and (H) nucleus accumbens. (B, I) Differential expression of APE1 protein within the mouse amygdala and accumbens after fibril infusions. Average size of the traced outline of the mouse (C) amygdala and (J) accumbens in sagittal sections. (D-F) APE1 expression in the human amygdala from the UCLA and University of Miami cohorts was determined by Western immunoblotting and expressed as a fraction of total protein levels in D (see Fig. S9, S10, and S11). (E) Differential expression of APE1 protein in the amygdala of subjects with Lewy body disorders compared to unaffected controls. (F) Full-length immunoblots depicting APE1 and total protein expression. The entire lane of the Total Protein REVERT stain was quantified. (G) Representative images of the mouse nucleus accumbens. A blinded observer performed counts of (K) APE1+ and (L) NeuN+ cells per field of view in the nucleus accumbens. Note that the APE1 immunostaining in the female accumbens in the PBS group is notably weaker than in PBS-infused males, as is also evident in the quantified data, and was captured at high exposures with low contrast to visualize virtually all signal plus background. Data in panels A, C, D, H, and J-L are shown as the mean ± S.D. Two-way ANOVAs were followed by the Bonferroni post hoc in panels A, C, H, and J-L, and the Kruskal-Wallis was followed by the Dunn’s test in panel D (also see parametric tests in Fig. S11A-B). Statistical interactions between biological sex and the disease model are noted below respective graphs. Data in B, E, and I were analyzed by the two-tailed Student’s t test. *p≤0.05, **p≤0.01, ***p≤0.001 male vs. female; +p≤0.05 PBS vs. fibrils (mice) or control vs. diseased (humans).

