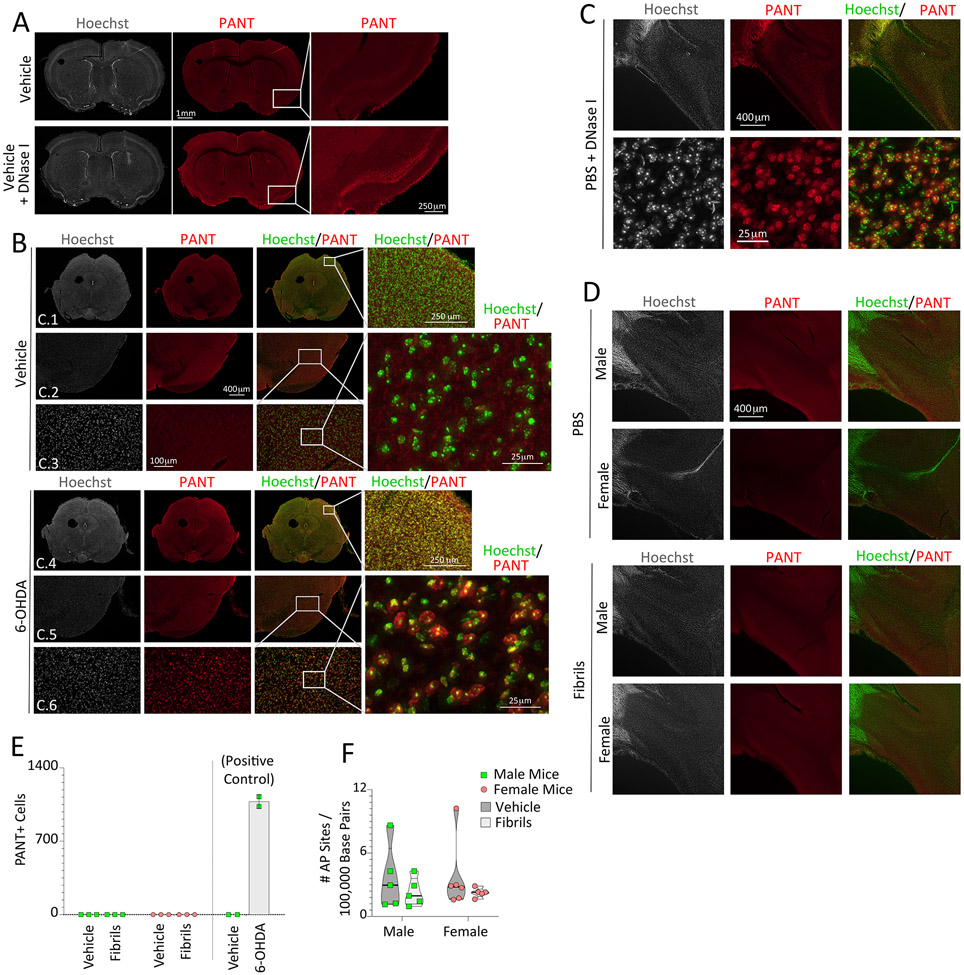
Figure 4. α-synucleinopathy does not elicit robust DNA damage in limbic structures, in contrast to 6-OHDA infusions in the mouse striatum.
(A-B) DNA polymerase I-mediated biotin-dATP nick translation (PANT) labeling of single-stranded DNA breaks was used to assess DNA damage in three-month-old male mice one week following striatal infusions of 6-hydroxydopamine (6-OHDA; 4 μg) or an equal volume of 0.02% ascorbic acid in saline (1.6 μL). DNase I was briefly applied to adjacent brain sections as a positive control (as in A). The Hoechst reagent was applied to stain all nuclei. Rows C.1 and C.4: Representative images of the mesencephalon. Rows C.2 + C.5 and C.3 + C.6: Images of the ventral mesencephalon at increasing magnification. (C-D) PANT labeling on sagittal brain sections from male and female mice bilaterally infused in the OB/AON at three months of age with fibrils or PBS and assayed six months later. (C) DNase I-treated sagittal sections of the AON from a PBS-infused male mouse, captured with 4× (top row) and 20× (bottom row) objectives. (D) Representative images of the AON from PBS and fibril-infused male and female mice. (E) PANT+ cell counts per field of view in the AON of vehicle (PBS) or fibril-infused mice (n=3 per group) and in the ventral mesencephalon of vehicle (ascorbic acid in PBS) or 6-OHDA-infused mice (n=2 per group). No statistical tests were performed on the right side of panel E given the n of 2 mice in the 6-OHDA/vehicle groups. Data are shown as mean ± S.D. (F) Eight-month-old male and female mice were bilaterally infused in the OB/AON with sonicated α-synuclein fibrils (5 μg) or an equal volume of PBS (1 μL). Three months later, DNA from the right piriform cortex was harvested for assessment of apurinic/apyrimidinic (AP) sites using a biotin-tagged aldehyde-reactive probe. Violin plots in panel F illustrate interquartile ranges as horizontal lines and density estimations of data distributions as the plot width (not statistically significant, either by parametric two-way ANOVA or by nonparametric one-way Kruskal-Wallis test).

