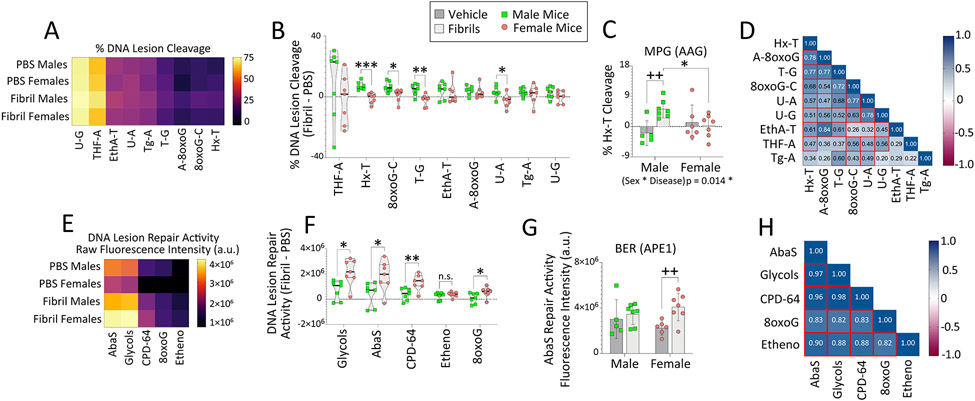
Figure 8. Fibril-infused female mice display inducible DNA repair activities for oxidative DNA lesions.
Eight-month-old male and female mice were bilaterally infused in the OB/AON with sonicated α-synuclein fibrils (5 μg) or an equal volume of PBS (1 μL). The OB/AON was collected for the Glyco-SPOT and ExSy-SPOT assays three months later. (A-D) For the Glyco-SPOT, excision/cleavage of synthetic, specific DNA lesions was measured. (A) Heatmap depicting the mean excision of each Glyco-SPOT lesion. (B) Differential DNA cleavage elicited by fibril infusions in males vs. females. Percentage cleavage of (C) Hx-T lesions, repaired by the enzyme MPG (also known as AAG). (D) Correlation matrix heatmap depicting correlation coefficients between each variable assessed by the Glyco-SPOT for all animals. Heatmap cells with red borders denote correlations (p≤0.05). (E-H) For the ExSy-SPOT, the incorporation of nucleotide substrates into the repair of a lesioned DNA plasmid by base excision and nucleotide excision repair pathways was measured on a functionalized biochip. (E) Heatmap depicting mean repair capacity for each ExSy-SPOT lesion. (F) Differential DNA repair elicited by fibril infusions in males vs. females. (G) Raw fluorescence data showing repair of abasic sites by APE1. (H) Correlation matrix heatmap depicting correlation coefficients between each variable assessed by the ExSy-SPOT for all animals. Heatmap cells with red borders denote correlations (p≤0.05). Data in C and G are shown as the mean ± S.D. Violin plots in B and F illustrate interquartile ranges as horizontal lines and density estimations of data distributions as plot widths. Two-way ANOVAs in C and G were followed by the Bonferroni post hoc. For B and F, two-tailed Student’s t tests were performed. *p≤0.05, **p≤0.01, ***p≤0.001 male vs. female; ++p≤0.01 PBS vs. fibrils. For D and H, data were analyzed with Pearson’s correlation test (two-sided).

