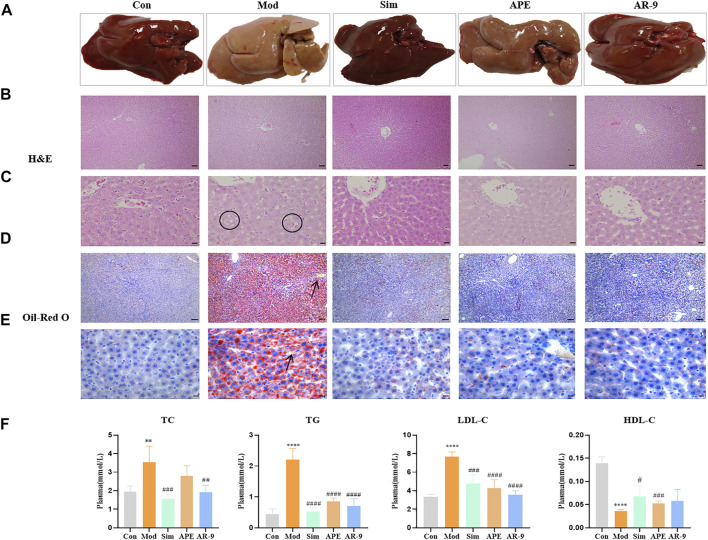
FIGURE 2.
Results of anti-HL activity of AR-9. Con: control group, Mod: high-fat diet group, APE: APE treatment group, and Sim: simvastatin calcium administration group. (A) Rat liver photographs in test groups. (B) H&E staining (scale bar, 200 μm) of rat livers in groups. (C) H&E staining (scale bar, 50 μm) of rat livers in groups. (D) Oil Red O staining (scale bar, 500 μm) of rat livers in groups, and (E) Oil-Red O staining (scale bar, 50 μm) of rat livers in groups. (F) Hypolipidemic effect of AR-9 (TC, TG, LDL-C and HDL-C levels in the plasma of rats). n = 5–6. * p < 0.05, ** p < 0.01, *** p < 0.001, and **** p < 0.0001 and # p < 0.05, ## p < 0.01, ### p < 0.001, and #### p < 0.0001 vs. Con or Mod group. The arrows indicate lipid droplets. The circles indicate vacuolar hepatic steatosis.

