FIGURE 5.
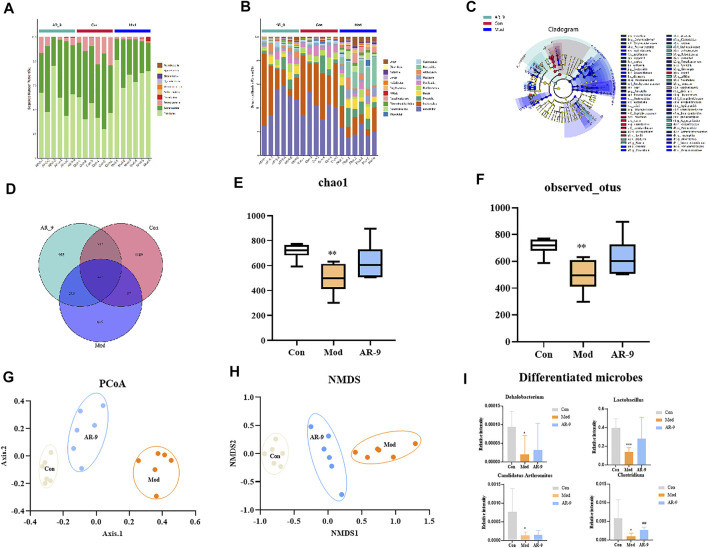
Intestinal microbiota analysis results of AR-9 treatment of HL. The histogram of species distribution at the phylum (A) and genus (B) levels in three groups was revealed by 16S rRNA sequencing (different colors represent different bacteria at phylum or genus levels). (C) Taxonomic cladogram generated by LEfSe analysis showing the differences of bacterial abundance on the genus level. (D) Venn diagram for bacterial communities of Con, Mod, and AR-9 groups. (E) Chao1 and (F) observed OTUs represent alpha-diversity indexes for each sample group. (G) PCoA analysis among Con, Mod, and AR-9 groups. (H) NMDS analysis among Con, Mod and AR-9 groups. (I) Results of four differential dominant bacteria at the genus level among AR-9 groups. * p < 0.05, ** p < 0.01 and # p < 0.05, and ## p < 0.01 vs. Con or Mod group.

