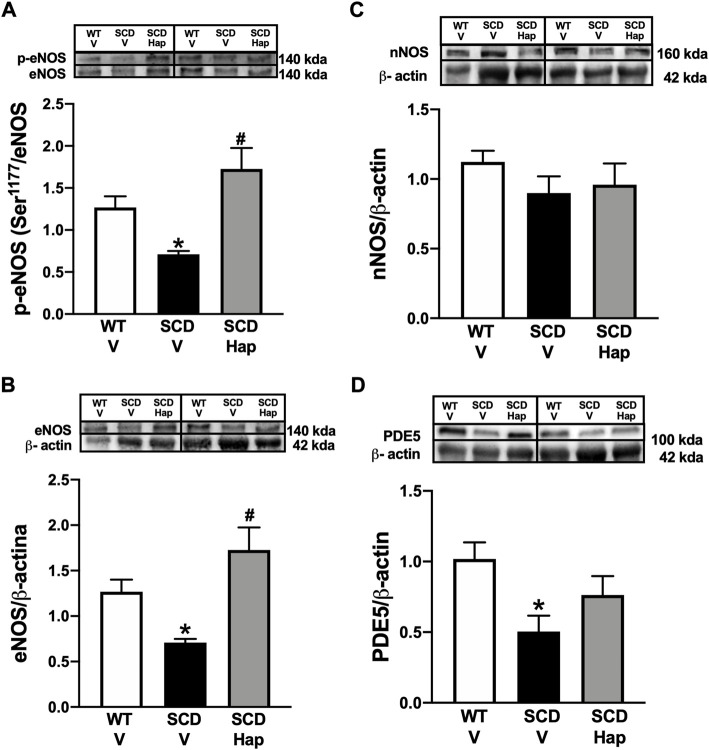
FIGURE 4.
Representative images of western blotting (top panels) and protein values (bottom panels) for p-eNOS (Ser-1177; (A), eNOS (B), nNOS (C), and PDE5 (D) in homogenates of penises from WT and SCD mice treated or not with haptoglobin (Hap). Data represent the mean ± S.E.M. for 6 mice in each group. A single band for eNOS, nNOS and PDE5 was normalized to β-actin. A single band for p-eNOS (Ser-1177) was normalized to eNOS. *p < 0.05 vs. WT-Vehicle. # p < 0.05 vs. SCD-Hap.

