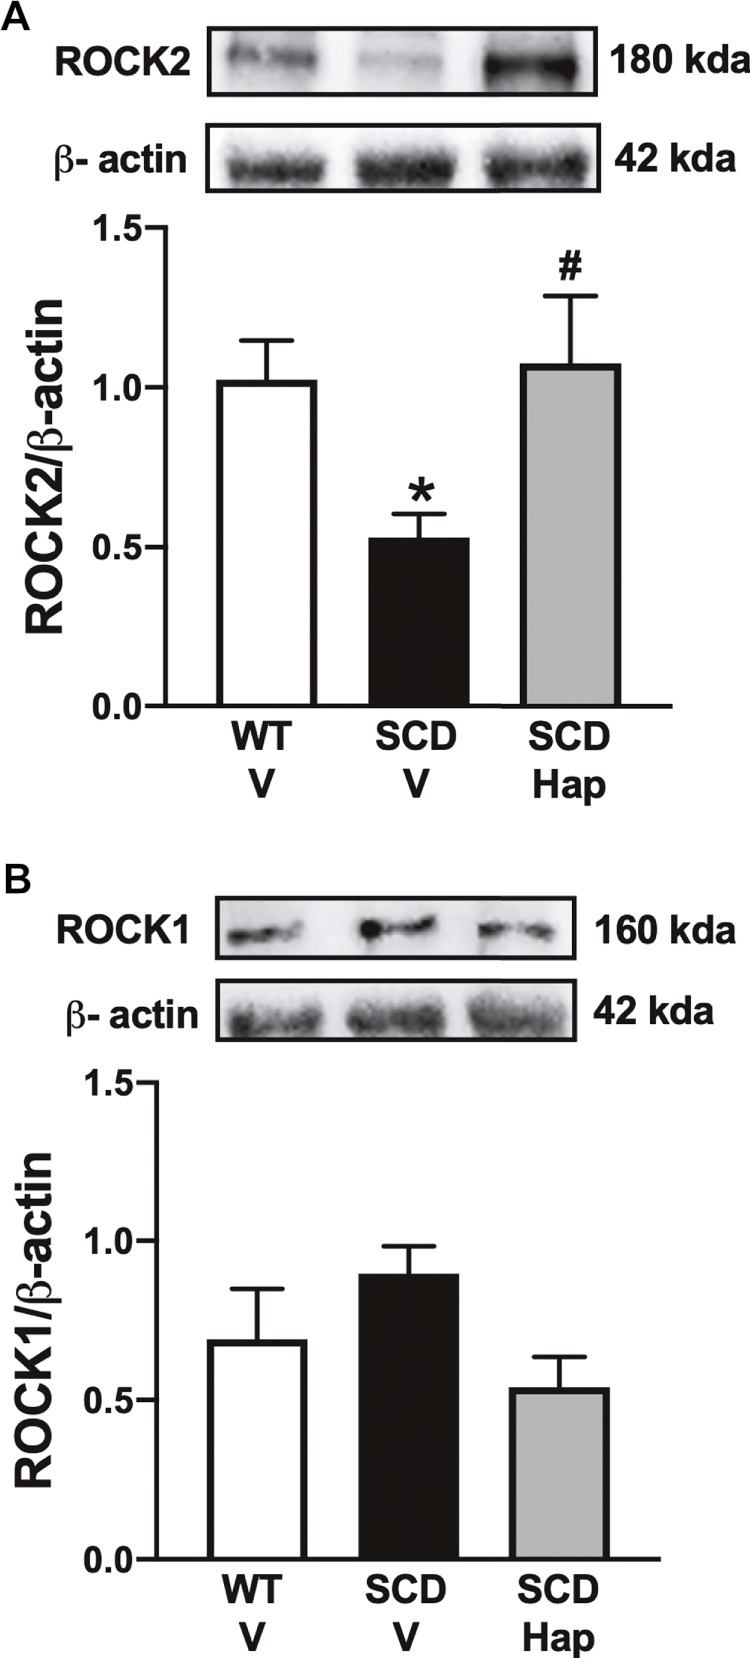
FIGURE 5.

Representative images of western blotting (top panels) and protein values (bottom panels) for ROCK2 (A) and ROCK1 (B) in homogenates of penises from WT and SCD mice treated or not with haptoglobin (Hap). Data represent the mean ± S.E.M. for 6 mice in each group. A single band for ROCK1 and ROCK2 was normalized to β-actin. *p < 0.05 vs. WT-Vehicle; #p < 0.05 vs. SCD-Hap.
