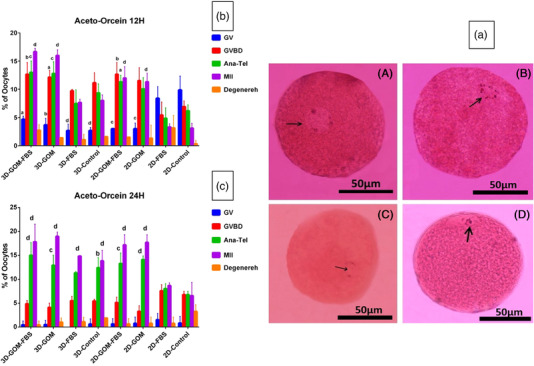
FIGURE 7.

(a) Nuclear maturation with Aceto‐Orcein staining at different times of IVM of rabbit oocytes. (A) GV stage of an oocyte with a nucleus (arrow) containing separate nucleoli and nuclear membranes. (B) Stage of GVBD oocytes without oolema and compressed chromatin (arrows) arranged on the mitotic spindle. (C) Anaphase‐Telophase step in which a pair of homologous chromosomes (arrows) are drawn towards the poles. (D) In the oocyte of stage MII, the arrow points to the first polar body (Scale Bar = 50 μm). (b) Oocyte maturation graph after 12 h with Aceto‐Orcein staining. A significant difference was shown in the control group. (a; p ≤ 0.05), (b; p ≤ 0.01), (c; p ≤ 0.001) and (d; p ≤ 0.0001). (c) Oocyte maturation graph after 24 h with Aceto‐Orcein staining assessment. A significant difference was shown in the control group (a; p ≤ 0.05), (b; p ≤ 0.01), (c; p ≤ 0.001) and (d; p ≤ 0.0001)
