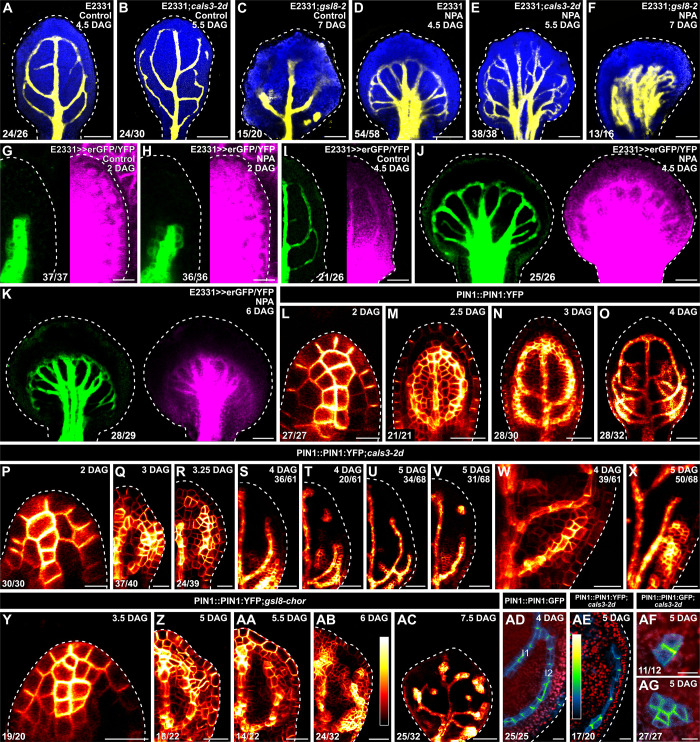
Fig 4. Auxin-transport-dependent vein patterning and regulated PD aperture.
(A–AG) Confocal laser scanning microscopy. First leaves (for simplicity, only half-leaves are shown in G–I, Q–V, and Z–AB). Blue (A–F) or red (AD–AG), autofluorescence; yellow (A–F) or green (G–K), GFP expression; magenta, YFP signals. Dashed white line delineates leaf outline. (G, H, L, P, Y) Side view, adaxial side to the left. (L–AC) PIN1::PIN1:YFP expression; look-up table (ramp in AB) visualizes expression levels. (AD–AG) PIN1::PIN1:GFP (AD, AF, AG) or PIN1::PIN1:YFP (AE) expression; look-up table (ramp in AE) visualizes expression levels. Top right: leaf age in DAG, genotype, and treatment (25 μM NPA), and—in S–V, X—reproducibility index. Bottom left (A–F, L–R, W, Y–AG) or center (G–K): reproducibility index (see S1 Table). Bars: (A–F, I–K) 120 μm; (G, H, Q, R, W, X, Y) 20 μm; (L, P, AD–AG) 10 μm; (M, N, S, T, Z, AA, AB) 40 μm; (O, U, V, AC) 60 μm. cals3-2d, callose synthase - 2 dominant; DAG, days after germination; erGFP, endoplasmic-reticulum-localized GFP; gsl8-2, glucan-synthase-like - 2; gsl8-chor, glucan-synthase-like - chorus; NPA, N-1-naphthylphthalamic acid; PD, plasmodesma; PIN1, PIN-FORMED 1.

