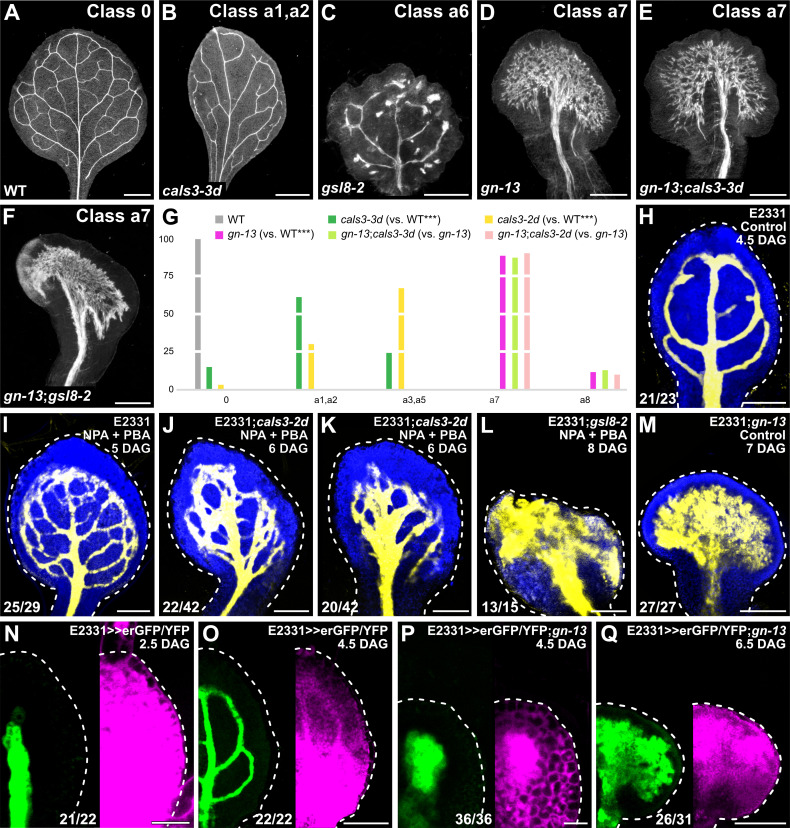
Fig 6. Control of PD-aperture-dependent vein patterning by GNOM.
(A–F) Dark-field illumination of mature first leaves illustrating phenotype classes (top right) and genotypes (bottom left). Classes 0, a1, a2, and a6 defined in Fig 1. Class a7: wide midvein and shapeless vascular cluster (D–F). (G) Percentages of leaves in phenotype classes. Classes 0, a1–a3, a5, and a6 defined in Fig 1. Class a8, shapeless vascular cluster. Difference between cals3-3d and WT, between cals3-2d and WT, and between gn-13 and WT was significant at P < 0.001 (***) by Kruskal-Wallis and Mann-Whitney test with Bonferroni correction. Sample population sizes: WT, 30; cals3-3d, 62; cals3-2d, 67; gn-13, 89; gn-13;cals3-3d, 100; gn-13;cals3-2d, 52. See S3 Data. (H–Q) Confocal laser scanning microscopy. First leaves. Blue, autofluorescence; yellow (H–M) or green (N–Q), GFP expression; magenta, YFP signals. Dashed white line delineates leaf outline. Top right: leaf age in DAG, genotype, and treatment (25 μM NPA + 10 μM PBA). Bottom left: reproducibility index (see S1 Table). Bars: (A, B) 1 mm; (C, D, F) 0.5 mm; (E) 0.25 mm; (H, J, K, O) 100 μm; (I, L, M, Q) 150 μm; (N, P) 25 μm. cals3-2d, callose synthase - 2 dominant; cals3-3d, callose synthase - 3 dominant; DAG, days after germination; erGFP, endoplasmic-reticulum-localized GFP; gn-13, gnom - 13; gsl8-2, glucan-synthase-like - 2; NPA, N-1-naphthylphthalamic acid; PBA, phenylboronic acid; PD, plasmodesma; WT, wild-type.

