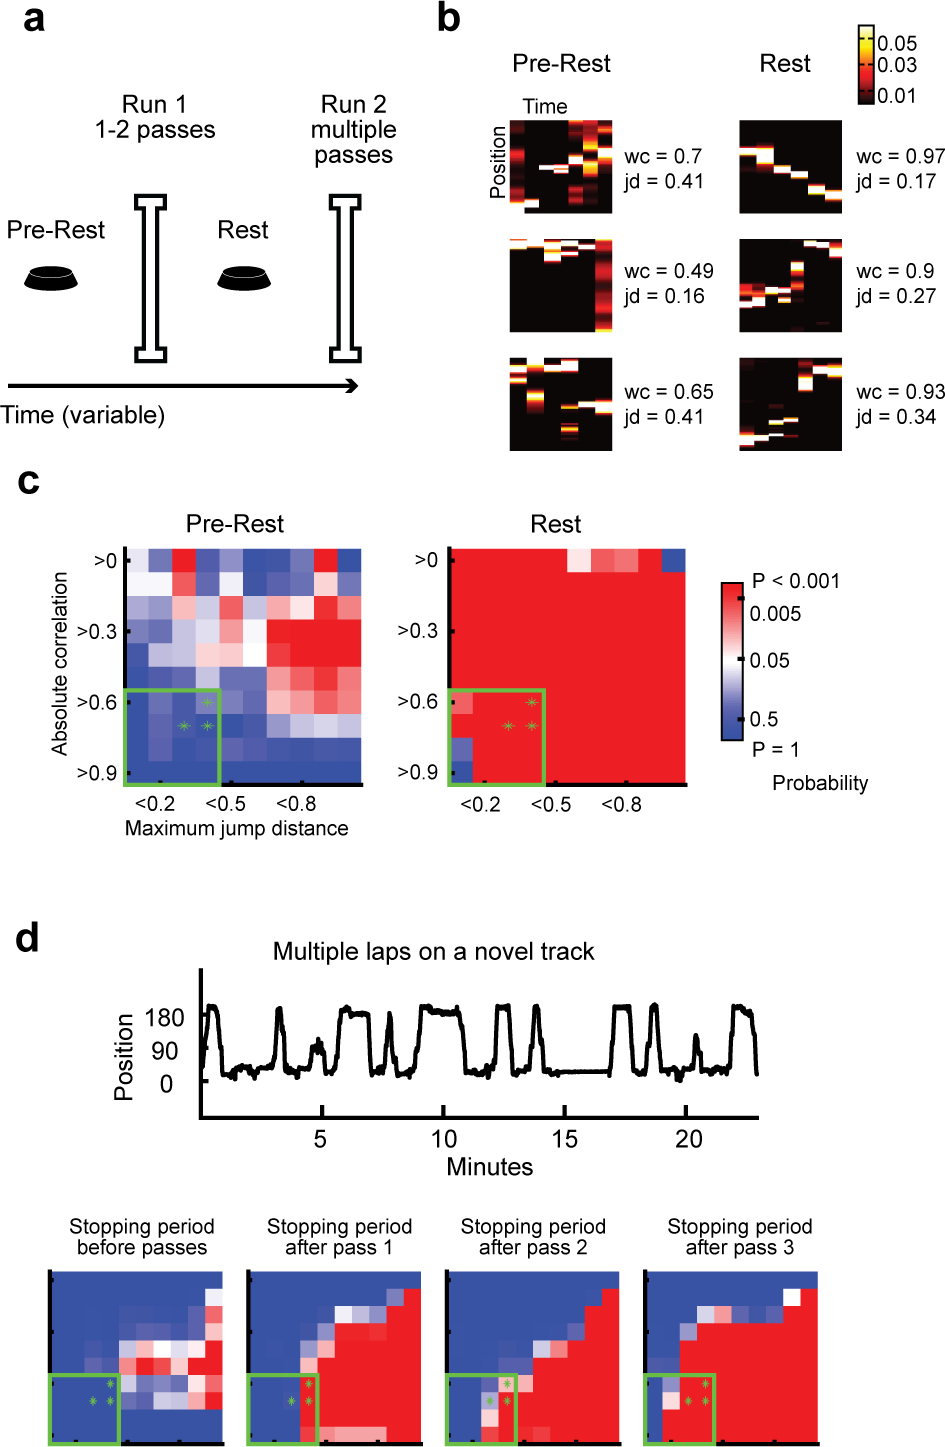
Figure 1. Replay after a single experience.

(a) Behavioral design: Rats rested on a small platform (Pre-rest) then ran 1–2 passes on a novel linear track (Run 1), then rested again on the platform (Rest), and subsequently ran on the same track for multiple passes (Run 2).
(b) From one example recording day, three replays during Pre-rest (left) and Rest (right), defined as follows: Of replays that crossed 40% of the track, replays were ranked by wc*(1-jd) and the top three were chosen. “wc” is absolute weighted correlation, “jd” is maximum jump distance (see Methods). Values for wc and jd shown on the right of each event.
(c) Significance matrices over parameter space generated by different combinations of wc and jd, over all recording days using the behavioral design of Figure 1a. Color bar shows probability values for all matrices in figure: blue values, insignificant (P > 0.05); red values, significant (P < 0.05); white, P = 0.05. P-values for the parameters denoted by the green asterisks, listed top-right to bottom-left: Pre-rest: P = 0.21, 0.73, 0.48; Rest: P = 2.0e-4, 2.0e-4, 2.0e-4. P-values cumulatively over all parameters in the green box: Pre-rest: P = 0.39; Rest: P = 2.0e-4. The selection of asterisk and box parameters followed that in (Silva, Feng and Foster, 2015)
(d) (Top) Alternative behavioral design: Example behavior from a recording session in which a rat ran multiple passes on a novel track (i.e. without the initial exposure depicted in Figure 1a). (Bottom) Significance matrices over all recording days using this behavioral design. P-values for asterisks, listed top-right to bottom-left : Stopping period prior to first pass: P = 1, 1, 1; Pass 1: P = 0.001, 2.0e-4, 0.6; Pass 2: P = 0.024, 8.0e-4, 0.13; Pass 3: P = 2.0e-4, 2.0e-4, 2.0e-4. Cumulative P-values for box: Stopping period prior to first pass: P = 1; Pass 1: P = 0.002; Pass 2: P = 0.006; Pass 3: P = 2.0e-4.
