. 2022 Sep 27;11:e78525. doi: 10.7554/eLife.78525

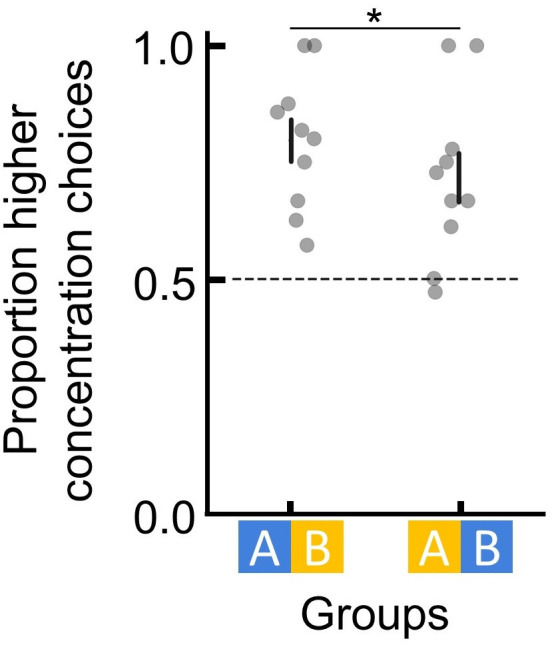
Figure 1. Bumblebees make decisions based on ordinal comparisons.

(A, C, and E) The corresponding sucrose concentration of each stimulus is displayed on a log scale to visually represent their relative differences according to Weber’s Law (Akre and Johnsen, 2014). Training sessions are indicated by separate grey backgrounds, and the test options in each experiment are indicated with dashed lines. The bi-colour squares indicate that the colours for the focal options used were counterbalanced across bees. (B, D, and F) Test results for each experiment. Groups indicate different counterbalanced training sequence and colour-reward contingency (see Figure 1—figure supplement 3 for more details). Each filled circle represents the proportion of choices for option C by an individual bumblebee (10 individuals per group). Dashed horizontal lines indicate chance performance. Vertical lines indicate mean ± SEM. p values were calculated from generalised linear models (Materials and methods); NS: p > 0.05; *: p < 0.01.

Figure 1.

Figure 1—figure supplement 1. General setup for experiments 1, 2, and 3.

Figure 1—figure supplement 1.

In each experiment, artificial flowers of paired colours were horizontally presented in the training and testing phase.

Figure 1—figure supplement 2. Specifications of the colours used for all the experiments.

Figure 1—figure supplement 2.

(A) Spectral reflectance plot of blue, orange, yellow, and green colours used. (B) Loci of colours in the hexagonal bee colour space, determined by the responses each colour elicits on the bee’s UV, blue, and green photoreceptors (Chittka, 1992).

Figure 1—figure supplement 3. Counterbalanced colour sets used in experiments 1–6.

Figure 1—figure supplement 3.

Groups of bees were trained and tested with counterbalanced colour sets and training sequences in each experiment.

Figure 1—figure supplement 4. Bees can discriminate flowers of different colours and sucrose concentrations.

Figure 1—figure supplement 4.

To ensure that bees were able to learn to discriminate between two differently coloured flowers in our setup, we examined bees’ preference between two flower types after having been trained individually on these flowers. One group of bees (n=10) learned that blue flowers contained 45% sucrose solution and that yellow flowers contained 30% sucrose solution. Another group of bees (n=10) learned the counterbalanced colour-reward contingency. During a subsequent unrewarded test (all flowers with unrewarding water), bees showed a clear preference for (landed more often on) the flowers that had been associated with the higher reward during training (generalised linear model [GLM]: N=20, 95% CI = [0.64, 1.37], and p=3.39e-5). These results show that in our setup, bumblebees were able to easily learn to discriminate the different flower colours used in our experiments and do so via the different sucrose concentrations associated with each flower type. Groups indicate different counterbalanced colour-reward contingency for bees. Dotted horizontal lines indicate chance performance. Vertical lines indicate mean ± SEM. p values were calculated from generalised linear models (Materials and methods); *: p < 0.01.