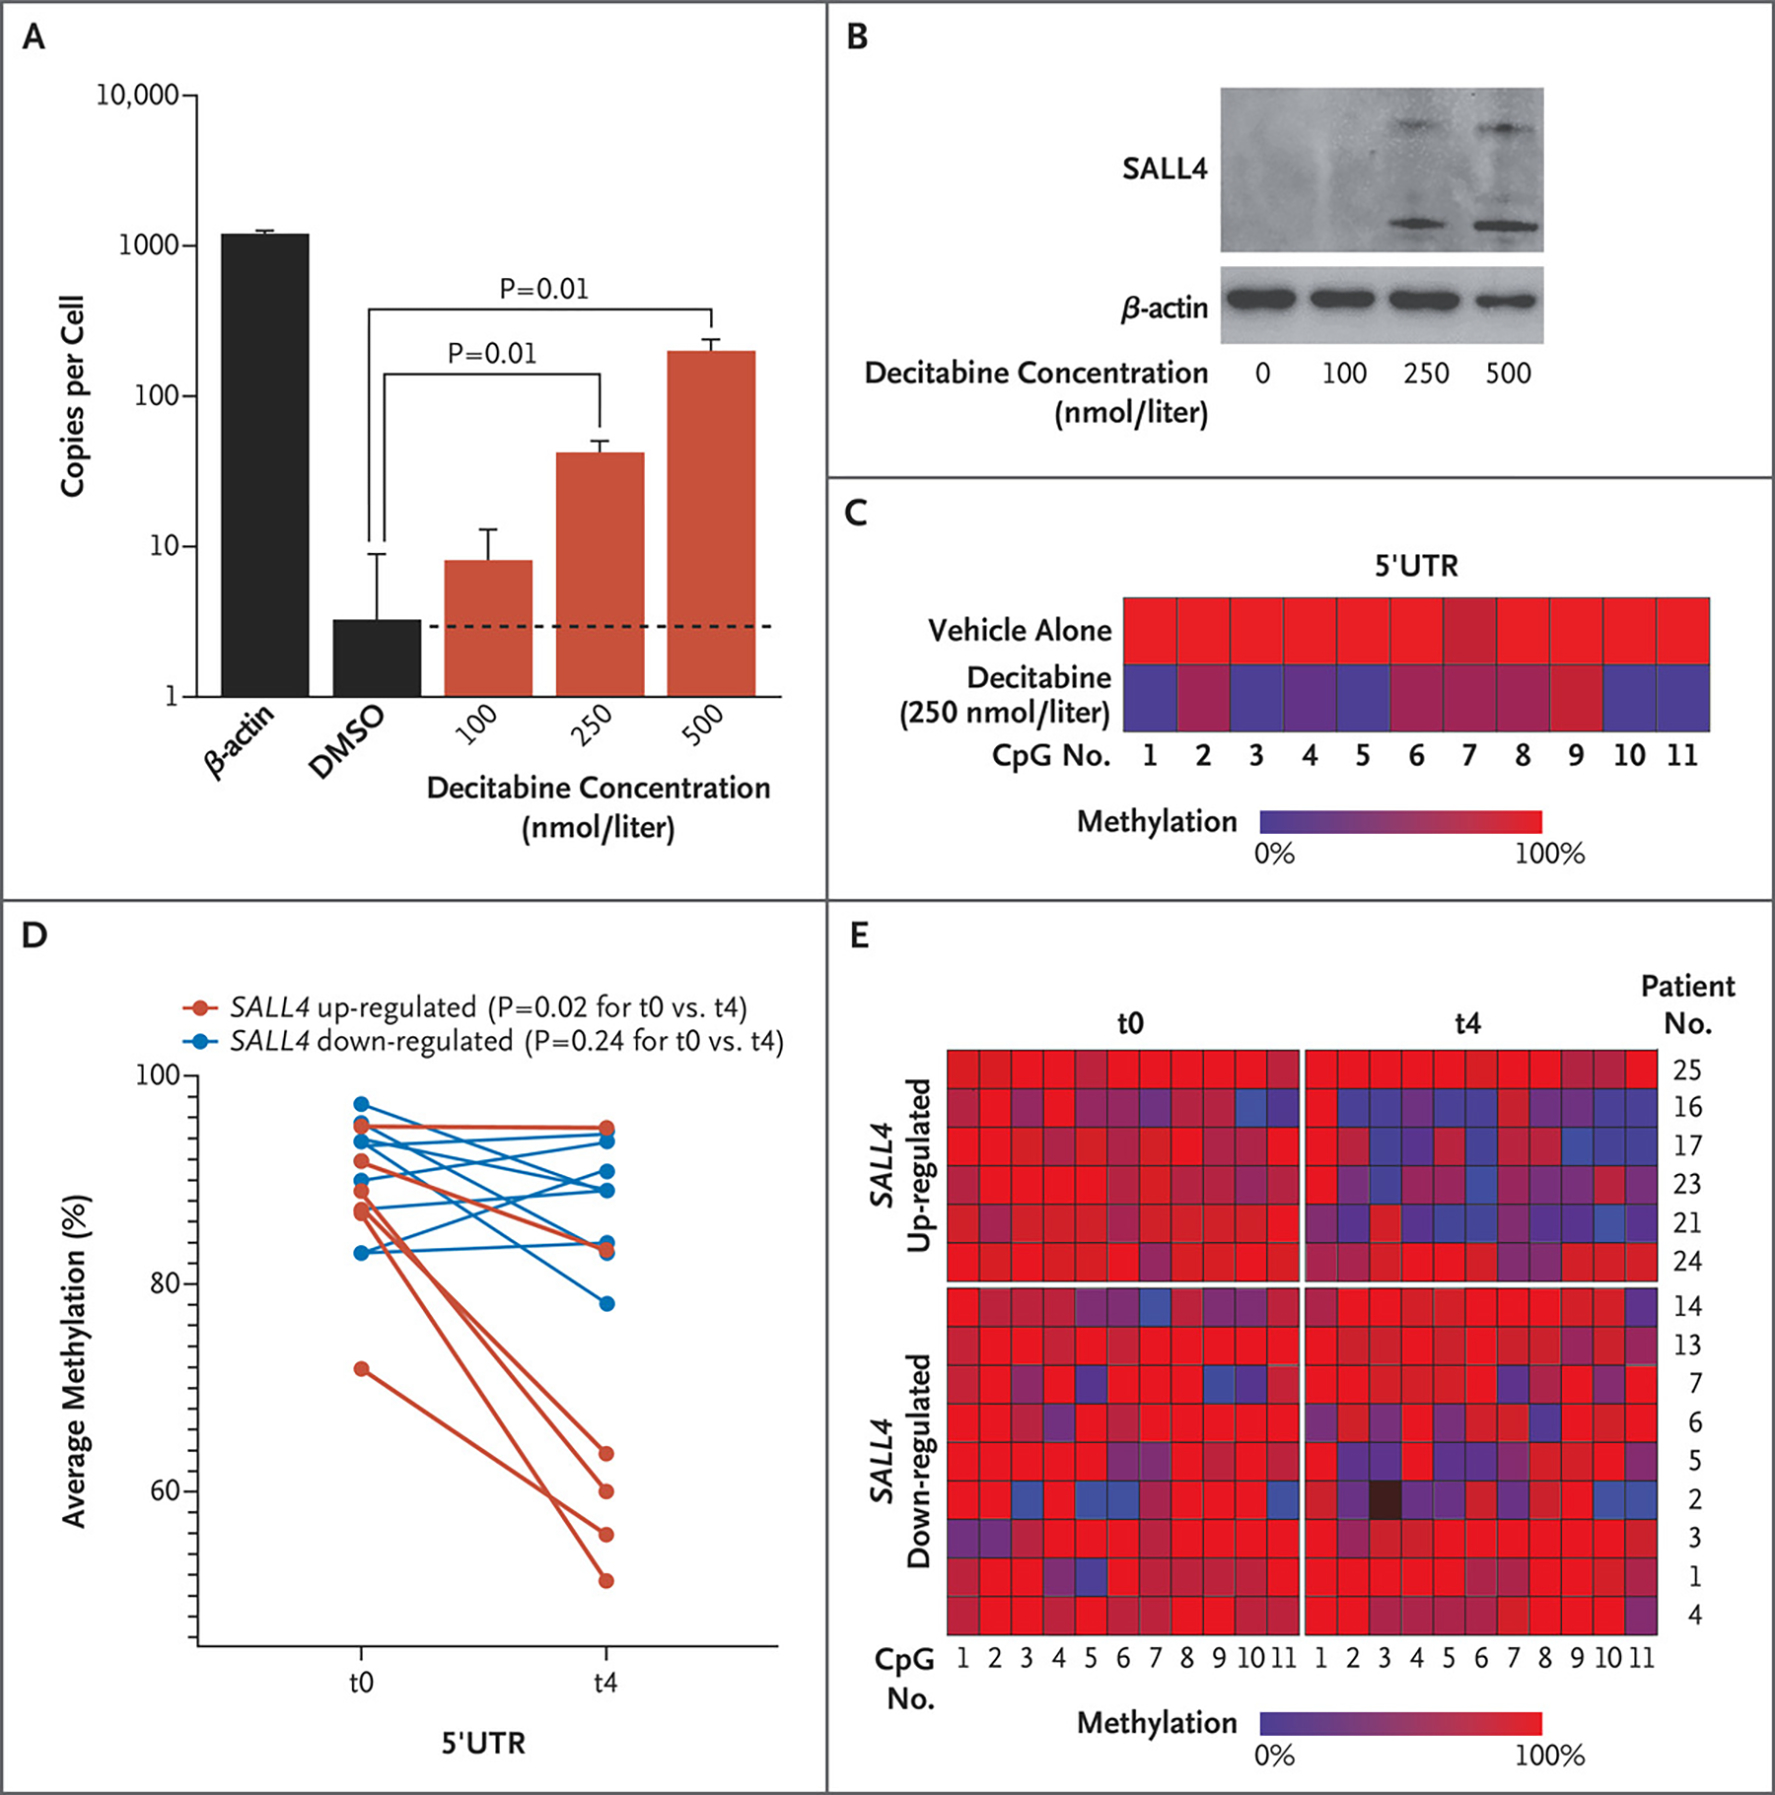
Figure 3. Demethylation of a Critical CpG Island and SALL4 Expression in Leukemic Cells and Patients with Myelodysplastic Syndrome Treated with a Hypomethylating Agent.

Panel A shows SALL4 copies per cell assessed by ddPCR assay in HL-60 cells treated with decitabine. A Wilcoxon rank-sum test was used to evaluate the statistical difference in copies per cell between dimethylsulfoxide (DMSO) and decitabine treatments. Data are shown as means, and error bars indicate standard deviations of three biologic replicates. Panel B shows Western blot analysis of HL-60 cells treated with decitabine. Panel C shows methylation profiling in HL-60 cells treated with vehicle alone as compared with those treated with decitabine at a dose of 250 nmol per liter. Treatment with a hypomethylating agent leads to demethylation of SALL4 in patients with myelodysplastic syndrome. Panel D shows average methylation across SALL4 5′UTR CpG loci (1 through 11) in patients with myelodysplastic syndrome before any cycles of azacytidine treatment (t0) and after four cycles of such treatment (t4). Red dots indicate patients with up-regulation of SALL4 expression after azacytidine treatments, and blue dots indicate patients with down-regulation of SALL4 after azacytidine treatments. Methylation values at t0 were compared with methylation values at t4 in each up- and down-regulated group separately. The average difference in methylation between the two time points was calculated with the use of a Wilcoxon matched-pairs signed-rank test (one-tailed) for each up- and down-regulated group separately. Panel E shows methylation changes in six patients with SALL4 up-regulation and nine patients with SALL4 down-regulation at t0 and t4.
