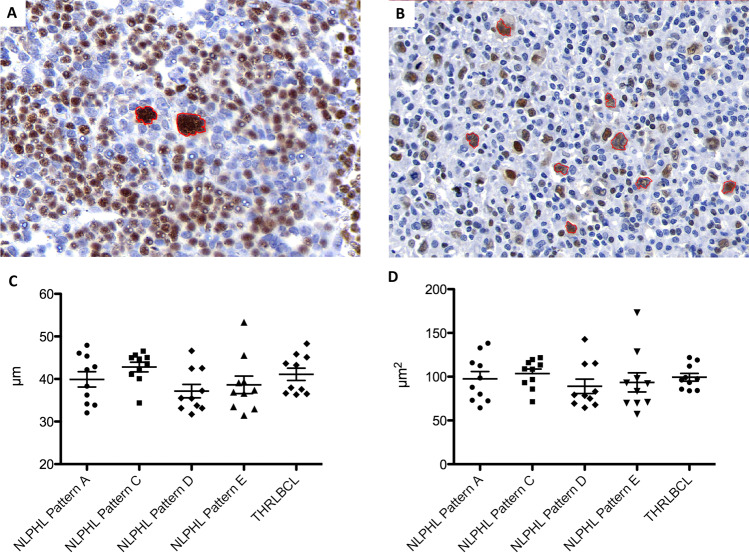
Fig. 1. 2D analysis of nuclear characteristics in different growth patterns of NLPHL and THRLBCL.
A Example of 2D analysis of an NLPHL pattern A case showing LP cells with multilobated nuclei (OCT2-immunostaining, LP cells encircled in red). B Example of 2D analysis of a THRLBCL case showing tumor cells with angulated nuclei (OCT2-immunostaining, tumor cells encircled in red). C Nuclear perimeters of tumor cells from NLPHL patterns (A, C, D, and E) and THRLBCL in 2D analysis. D Nuclear areas of tumor cells from NHLPL patterns (A, C, D, and E) and THRLBCL in 2D analysis.

