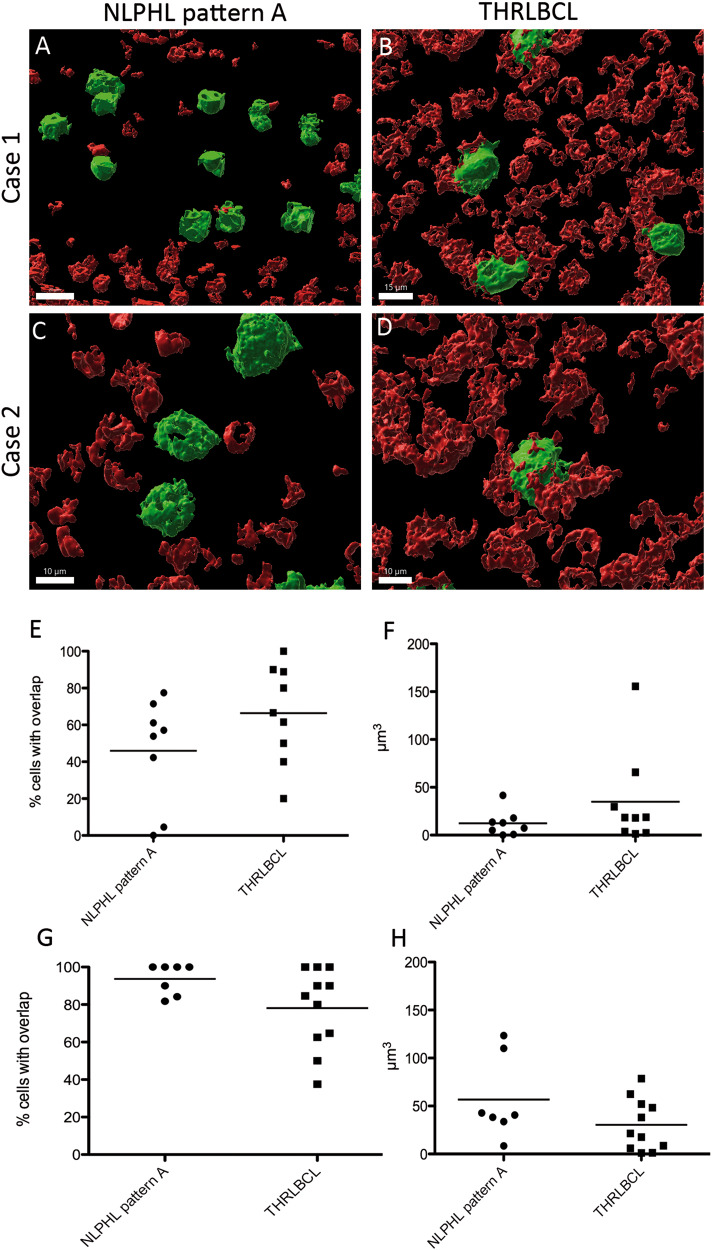
Fig. 6. Tumor cells in THRLBCL have more contacts with CD8+ T cells than LP cells in NLPHL pattern A.
A–D 3D reconstruction of thick sections double-stained with CD8 and CD79a. Tumor cells were identified by the large cell size and positivity for CD79a. A, C Examples from two NLPHL pattern A cases show little contact faces of tumor cells with CD8+ cells. B, D Examples from two cases of THRLBCL present many and relatively large overlapping surfaces between tumor cells and CD8+ T cells. E Mean percentage of tumor cells with contact to CD8+ T cells in NLPHL and THRLBCL (Mann–Whitney-test, not significant). F Mean volumes of contacts between CD8+ T cells and tumor cells in NLPHL and THRLBCL (Mann–Whitney-test, not significant). G Mean percentage of tumor cells with contact to PD1+ T cells in NLPHL and THRLBCL (Mann–Whitney-test, not significant). H Mean volumes of contacts between PD1+ T cells and tumor cells in NLPHL and THRLBCL (Mann–Whitney-test, not significant).

