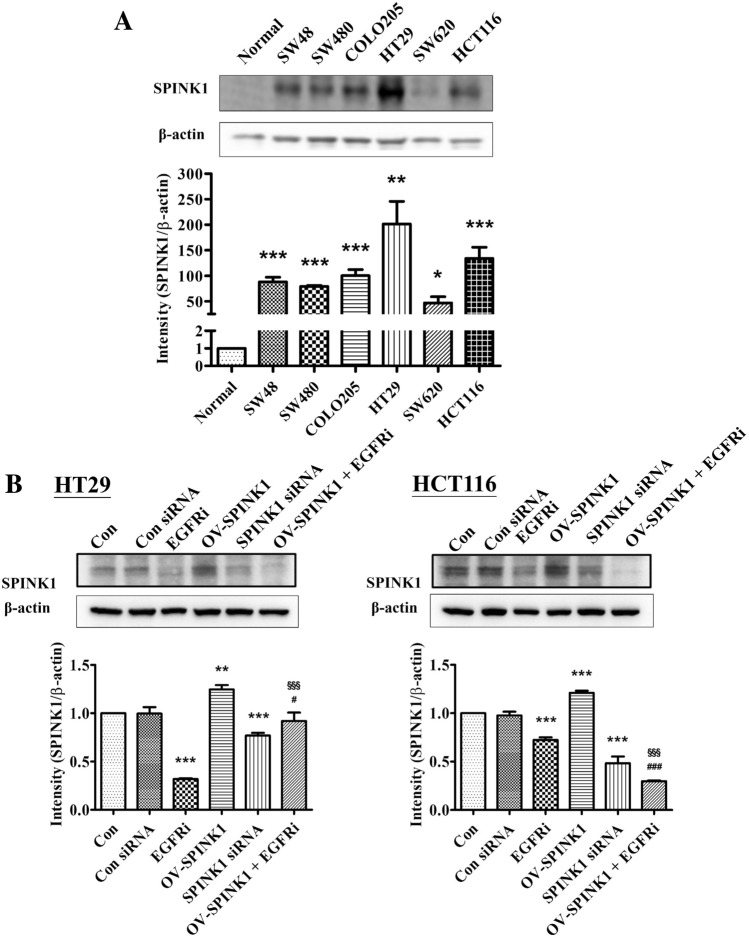
Fig. 2.
A Western blot of SPINK1 in all cell lines and the relative protein expressions of SPINK1 in all cell lines. B Western blot of SPINK1 in all cell lines and the relative protein expressions of SPINK1 in HT-29 cell lines and HCT-116 cell lines treated by non-siRNA, EGFR inhibitor (EGFRi), OV-SPINK1 and SPINK1 siRNA (with/without EGFR inhibitor). *p < 0.05, **p < 0.01 and ***p < 0.001 as compared to the control group (n = 3/group); #p < 0.05, ##p < 0.01 and ###p < 0.001 as compared to the OV-SPINK1 group. §p < 0.05, §§p < 0.01 and §§§p < 0.001 as compared to the EGFRi group (n = 3/group)

