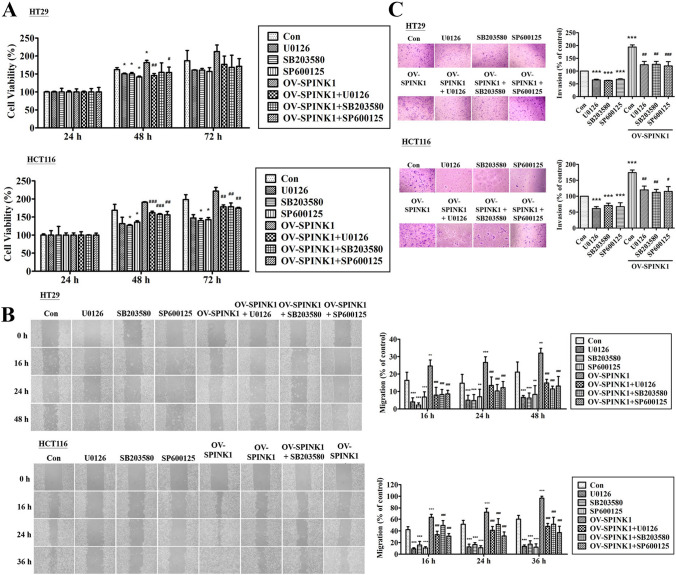
Fig. 5.
A The growth curve of HT-29 and HCT-116 cells treated with p-SPINK1 and inhibitors cultured in 24 well plates in 24 h, 48 h and 72 h. B Wound healing assay and the percentage of migration cells of HT-29 and HCT-116 cells in 0 h, 24 h, 36 h and 48 h after treated with p-SPINK1 and inhibitors. C Transwell invasion assay and the number of invaded cells of HT-29 and HCT-116 cell lines during one day transfected treatment with p-SPINK1 and inhibitors. The quantitative data analysis was expressed as mean ± SEM. *p < 0.05, **p < 0.01 and ***p < 0.001 as compared to the control group (n = 3/group); #p < 0.05, ##p < 0.01 and ###p < 0.001 as compared to the OV-SPINK1 group (n = 3/group)

