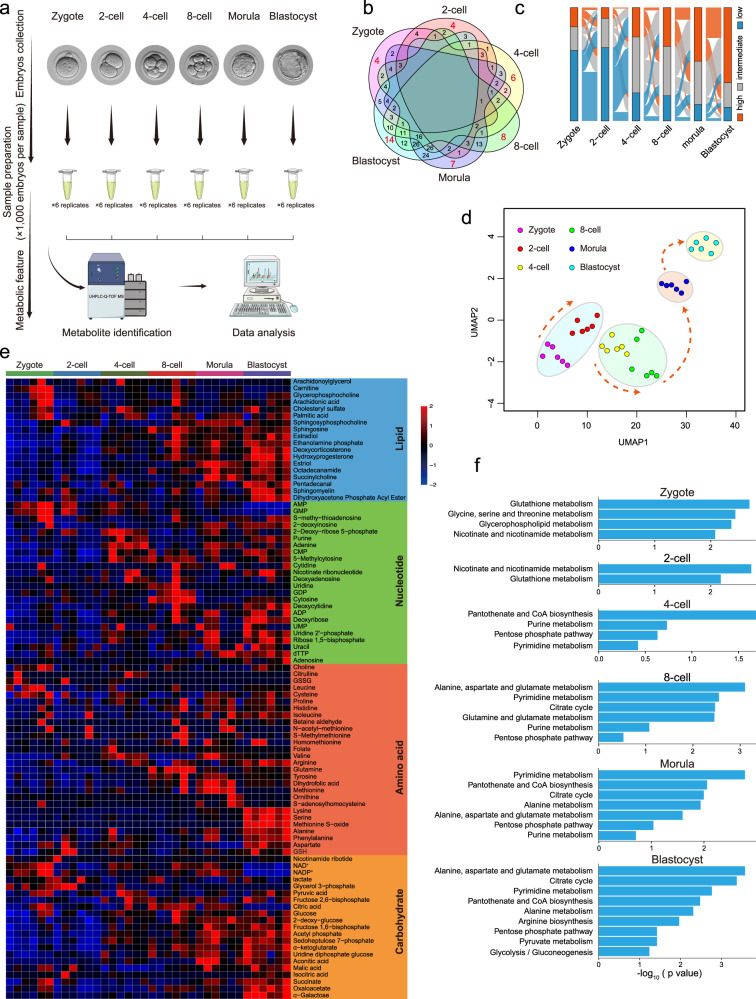
Fig. 1. Metabolomic profiling of mouse pre-implantation embryo development.
a Schematic overview of mouse embryo preparation and metabolome profiling during mouse pre-implantation embryo development. b Venn diagram showing the overlap among metabolites across all stages. The number of significantly abundant metabolites is shown in red. c Alluvial plots of the global dynamics of high, intermediate, and low metabolites based on their levels during early embryo development. d UMAP analysis. Metabolites marked with the same color represent six replicates of the same stage. e Heatmap of metabolite dynamics during mouse embryo development, classified according to metabolic pathways. f KEGG analysis of abundant metabolites in each stage.

