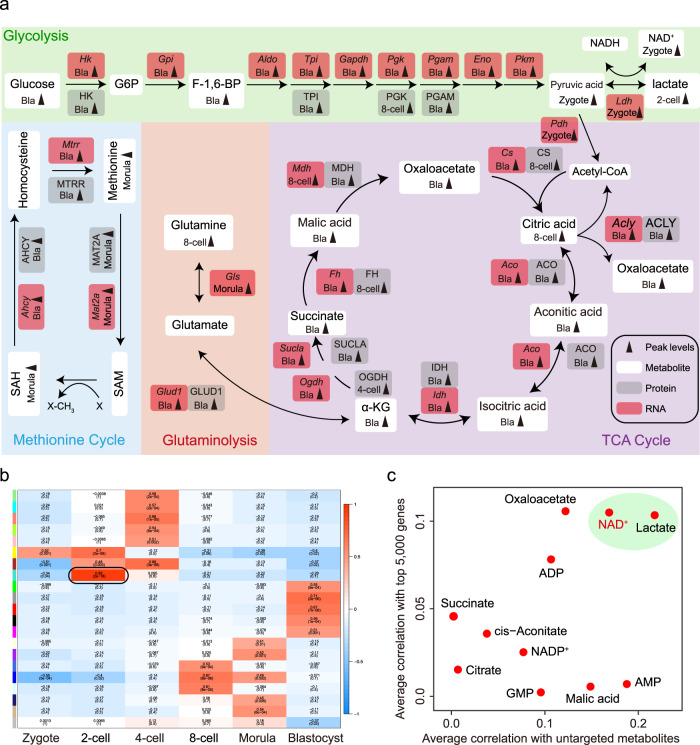
Fig. 2. Activities of metabolic pathways during mouse pre-implantation embryo development.
a Schematic diagram of carbohydrate metabolism, integrated with transcriptomic and proteomic data. Gray arrows indicate peak level at indicated stage. White boxes represent metabolites, and gray and red boxes represent protein and mRNA of indicated metabolic enzymes, respectively. b Stage-specific co-expression genes and metabolite modules and their correlation to development stage. Each row corresponds to a co-expression module. Numbers in each square represent correlation coefficients between the module and development stage, with p-values in brackets. Red and blue squares indicate positive and negative correlations, respectively; white indicates no correlation. c Correlation of metabolites and genes at the 2-cell embryo stage. The X-axis shows the correlations of a specific metabolite with the top 5000 genes. The Y-axis shows the correlations of a specific metabolite with other metabolites.

