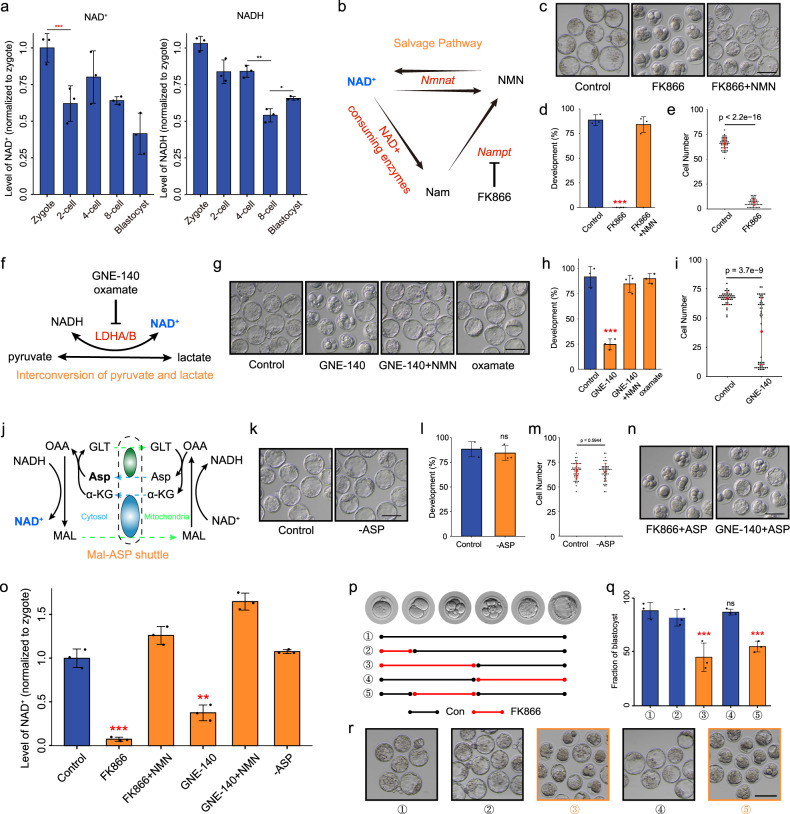
Fig. 3. NAD+ depletion impairs early mouse embryo development.
a NAD+ and NADH levels during early mouse embryo development. b Overview of the NAM salvage pathway. c Representative images and d developmental rates of control, FK866-treated, and FK866 + NMN-supplemented embryo groups. Data are from three independent experiments. ***P < 0.001 (Student’s t-test). Scale bars, 50 μm. e Quantification of cells in control and FK866-treated embryo groups. Dots represent cell numbers of single embryos. f Overview of the interconversion pathway of pyruvic acid and lactate. g Representative images and h developmental rates of control, GNE-140-treated, GNE-140+NMN-supplemented, and oxamate-treated embryos. Data are from three independent experiments. ***P < 0.001 (Student’s t-test). Scale bars, 50 μm. i Quantification of cells in control and GNE-140-treated embryos. Dots represent cell numbers of single embryos. j Overview of the Mal-Asp shuttle. GLT glutamate, MAL malate, OAA oxaloacetate. k Representative images and l developmental rates of control and Asp-deletion embryos. Data are from three independent experiments. ***P < 0.001 (Student’s t-test). Scale bars, 50 μm. m Quantification of cells in control and Asp-deletion embryos. Dots represent cell numbers of single embryos. n Development of FK866- and GNE-140-treated embryos supplemented with Asp. o NAD+ level in control, FK866-treated, FK866 + NMN, GNE-140-treated, GNE-140 + NMN, and Asp-deletion late 2-cell embryos. p–r Timeline of FK866 treatment. Embryos were cultured in control or FK866-addition medium. The stages of FK866 treatment are indicated in (p). Developmental rates q and representative images r of each group are shown. Data are from three independent experiments. **P < 0.01, ***P < 0.001 (Student’s t-test). Scale bars, 50 μm.

