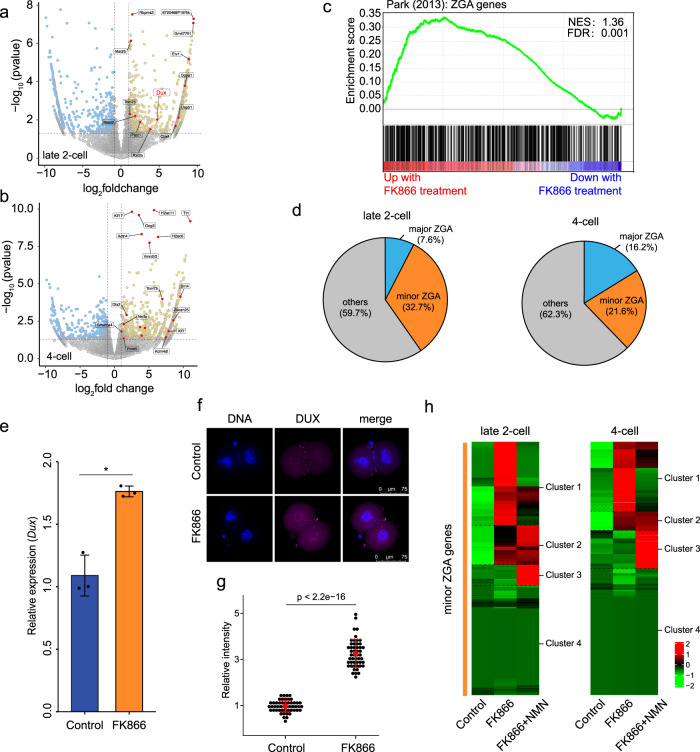
Fig. 4. NAD+ depletion disturbs minor ZGA in early mouse embryos.
RNA-seq analysis of control and FK866-treated a late 2-cell and b 4-cell mouse embryos. Volcano plots show gene expression changes. Yellow and blue dots indicate upregulated (fold change > 1) and downregulated (fold change < −1) genes with P < 0.05. c Gene set enrichment analysis (GSEA) of ZGA genes showed preferential upregulation in FK866-treated late 2-cell embryos. d Pie chart showing the fraction of minor and major ZGA genes upregulated in late 2-cell and 4-cell embryos. e Results of quantitative polymerase chain reaction (qPCR) showing Dux upregulation in FK866-treated late 2-cell embryos. Data are means ± SEM from three independent experiments. f Representative confocal images of control and FK866-treated embryos stained with Dux antibody. Scale bars, 75 µm. g Quantification of DUX fluorescence intensity in control and FK866-treated embryos. Each dot represents a single nucleus. h Heatmaps show that minor ZGA genes were upregulated between control and FK866-treated embryos, which was rescued by NMN supplementation. NMN recovered the overexpression of 62% and 72.2% minor ZGA genes at late 2-cell and 4-cell stages, respectively. Mean values of two biological replicates were scaled and are represented as Z scores.

