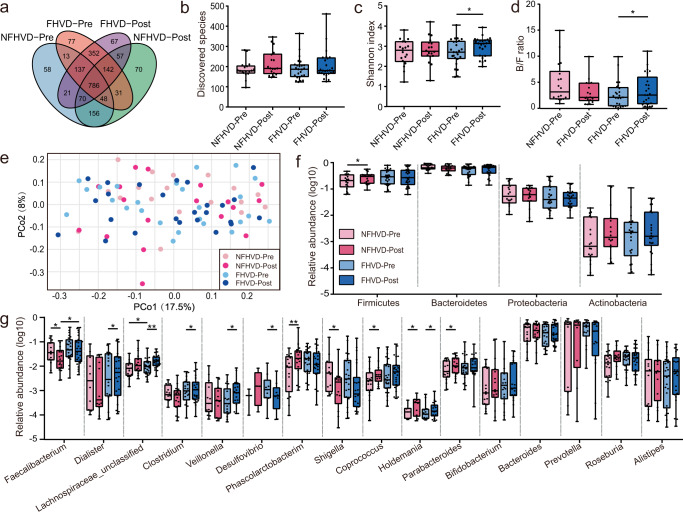
Fig. 1. Gut microbial composition differences in FHVD and NFHVD.
Variations in (a) Venn diagram of the overlap at OTU level. (b) The discovered species. (c) The alpha diversity (Shannon index). (d) The Bacteroidetes/Firmicutes ratio. (e) Overall gut microbial structure, principal co-ordinates analysis based on the Bray-Curtis distance. (f) The relative abundance on phylum level. (g) The relative abundance on genus level. FHVD-Pre (n = 25), FHVD-Post (n = 25), NFHVD-Pre (n = 18), and NFHVD-Post (n = 18). OTU, Operational Taxonomic Unit. Wilcoxon matched pair signed-rank tests (two tailed) were used to analyze pairwise Pre and Post within diets. A Mann-Whitney test was used to analyze differences between the FHVD and NFHVD groups at the same time point. *P < 0.05 and **P < 0.01. The bounds, whiskers and percentile of each box plot represented maximum, 75 percentile, median, 25 percentile and minimum from the top to the bottom respectively.

