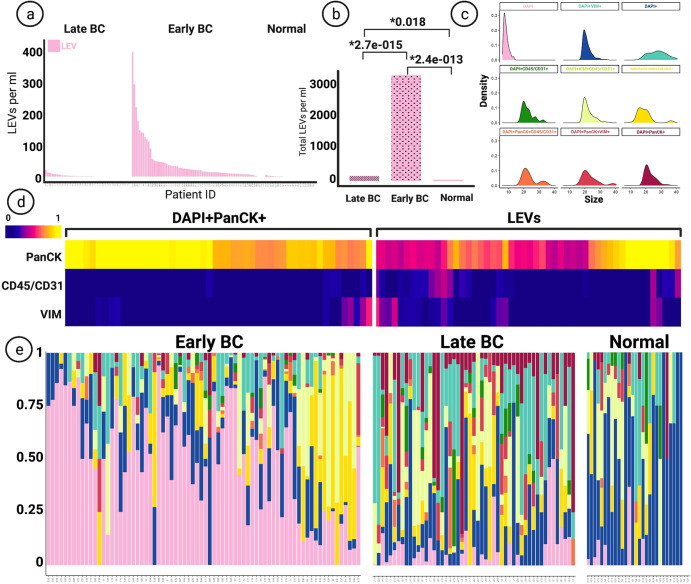
Fig. 3. Comparison of Tumor-Associated LEVs.
a Frequency of enumerated LEVs between late-stage, early-stage, and the normal group based on channel classification. b Comparison of the distribution of LEVs between groups, Kruskal-Wallis H test (one-way ANOVA) performed. All p values below *0.05 considered statistically significant. c Size comparison of LEVs and rare cell events. All sizes represent diameters in micron. Sizes calculated by feature conversion from 100x images. d Heatmap displaying signal intensity of biomarkers on LEVs and DAPI + PanCK+ cells. e Scaled frequency plots of rare cells and LEVs in patients, designated colors represent classification groups marked in the figure on panel c.

