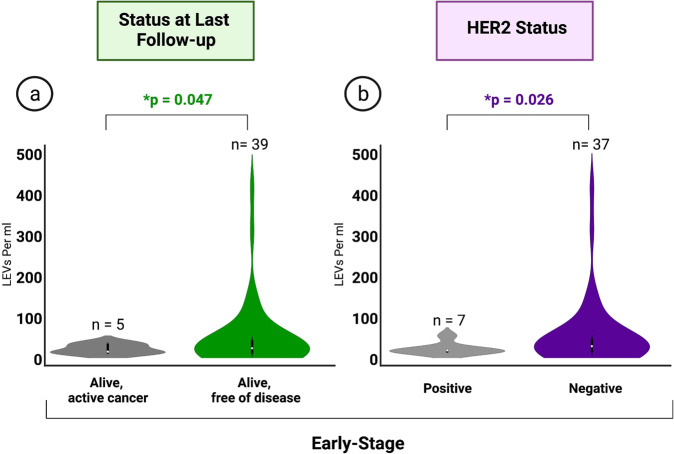
Fig. 4. Clinical Data.
a Comparison of summed LEV levels between differing statuses at last follow-up in early-stage BC. Kruskal-Wallis H test (one-way ANOVA) performed. All p values below *0.05 considered statistically significant. b Comparison of summed LEV levels between early-stage patients with clinically identified HER2 + and HER2- tumors. Kruskal-Wallis H test (one-way ANOVA) performed. All p values below *0.05 considered statistically significant. Data illustrated in truncated violin plots.

