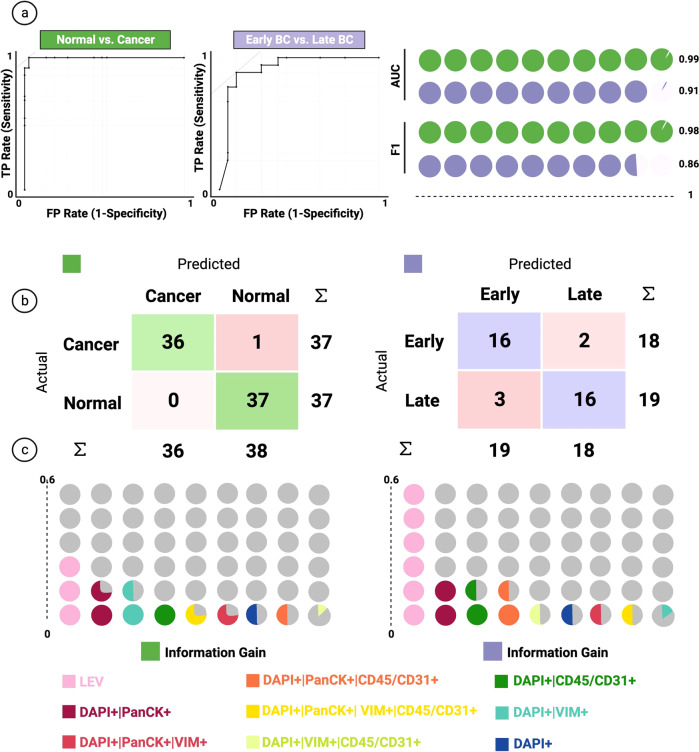
Fig. 5. Classification Model.
a On the left, ROC analysis of the random forest model for each target variable class. Curves represent merged prediction from folds. On the right, AUC and F1 score of the corresponding models. b Confusion matrix of the random forest model on the test set. c Ranking of the features for classification based on information gain. Each color represents a channel-classified event group detailed marked in the figure.

