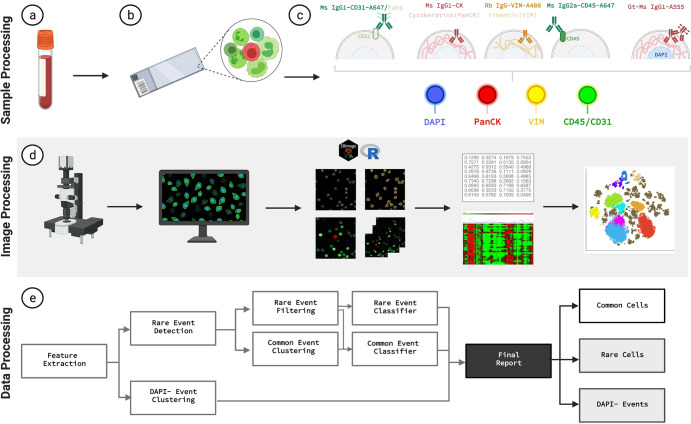
Fig. 6. HDSCA3.0 Workflow Overview.
a–c Blood specimens are collected, processed, and plated onto slides, and undergo immunofluorescent staining. d Slides are scanned, acquired images are segmented, cellular features are extracted using R and EBImage software, dimensionality reduction analysis is applied to the cells. e Data processing pipeline allows for rare cell detection, filtering, and classification, and DAPI- event separation for curation of final report. Created with BioRender.com.

