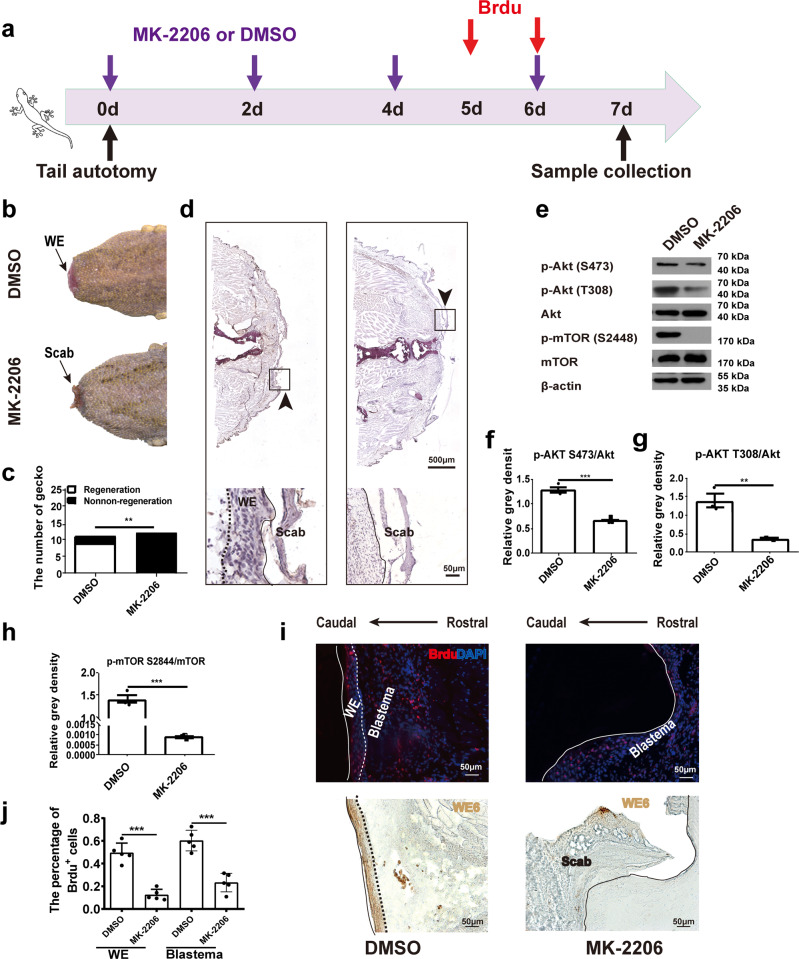
Fig. 3. Akt blocking lowered the proliferation of wound epithelium.
a The schematic picture of timeline for drug delivering and sample collection. b Formation of wound epithelium (WE) in geckos in the control (DMSO) and Akt inhibition groups (MK-2206). c Number of geckos with regeneration in control and Akt inhibition groups. N = 10 for each group. d H&E staining of tail tissues from control and Akt inhibition groups. Solid arrow indicates the injury site, dashed box indicates the magnified area, dotted line indicates border between wound epithelium and scab, and solid line indicates junction between rostral end of wound epithelium and blastema. Scale bar = 500 µm or 50 µm. N = 3. e Protein levels of p-Akt (Ser473, Thr308), Akt, p-mTOR (Ser2448), and mTOR in tail tissues. f–h Relative level of p-Akt (Ser473)/Akt, p-Akt (Thr308)/Akt, and p-mTOR (Ser2448)/mTOR in Fig. 3d. N = 3. i Immunofluorescence analysis of BrdU staining in control (DMSO) and Akt inhibition group (MK-2206) (upper panel). Immunohistochemistry analysis of WE6 staining of the same location of the samples. Solid line indicates the caudal border of wound epithelium, dotted line indicates border between wound epithelium and blastema. Scale bar = 50 µm. j Number of BrdU positive cells in control and Akt inhibition group. Values represent mean ± SD, N = 5, nsp > 0.05, *p < 0.05, **p < 0.01, ***p < 0.001.

