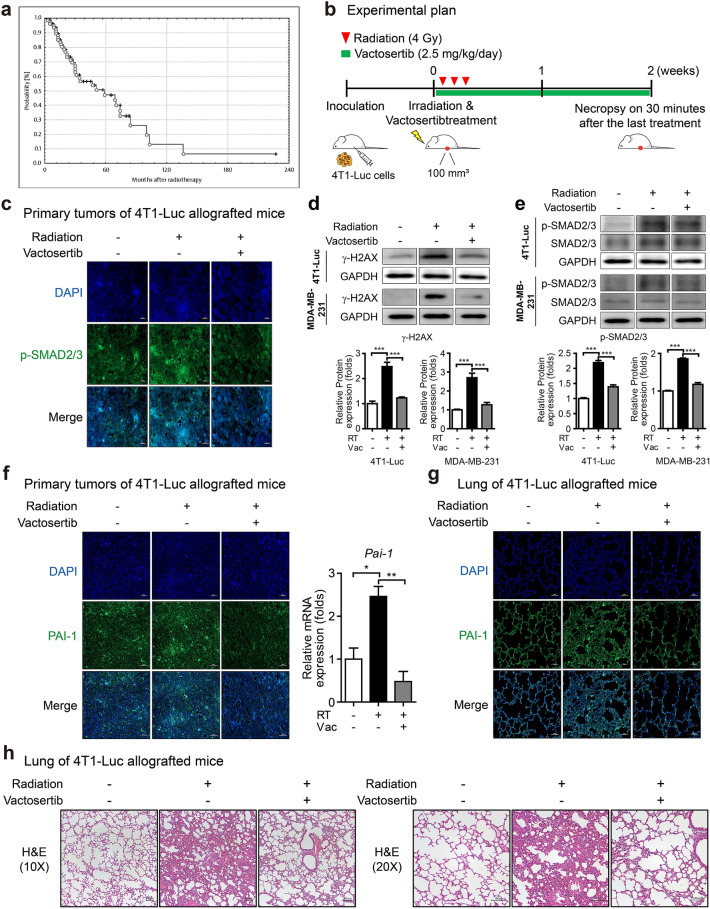
Figure 1.
Effect of vactosertib as a treatment strategy for radiation-induced fibrosis. (a) A Kaplan–Meier plot of the probability of being unaffected by fibrosis (> grade III) after radiotherapy. The risk of fibrosis estimated in 86 breast cancer patients increased with time after radiotherapy. Reprinted by permission from Johannes Claßen MD et al.: Springer Nature, Strahlentherapie und Onkologie17, (Fibrotic Changes after Postmastectomy Radiotherapy and Reconstructive Surgery in Breast Cancer, Johannes Claßen MD et al.), Copyright, (2010). (b) Scheme of the experimental mouse model of breast cancer for co-treatment with vactosertib and radiation. Mice were injected with 4T1-Luc cells and were divided randomly into three groups when tumor volume was 70–100 mm3. Mice were treated with vactosertib 2.5 mg/kg p.o. for two weeks and were concurrently irradiated with 4 Gy/day over their whole body for three days. (c) Protein expression of p-SMAD2/3 by fluorescence immunohistochemistry analysis in irradiated primary tumors of mice (× 40, scale bar: 20 μm). In confocal images, p-SMAD2/3 emitted bright green fluorescence. (d, e) Protein expression of γ-H2AX (d) and p-SMAD2/3 (e) in 4T1-Luc and MDA-MB-231 cells by western blot analysis (Band was normalized by GAPDH.). The band image was cropped after selecting a representative blot, and the sample was derived from the same experiment. Original blots are presented in Supplementary Fig. 1. (f) Fluorescence immunohistochemistry analysis and quantitative reverse transcription-polymerase chain reaction (qRT-PCR) analysis of PAI-1 in irradiated primary tumors of mice (Relative mRNA expression was normalized by Ppia.). Expression of PAI-1 was shown by green fluorescence image (× 20, scale bar: 50 μm). (g) Fluorescence immunohistochemistry analysis of PAI-1 in the lung of mice. Expression of PAI-1 was shown by green fluorescence image (× 20, scale bar: 50 μm). (h) H&E staining in the lungs of mice is displayed as images showing the morphology of the lungs and the degree of fibrosis by phase-contrast microscopy (× 10 and 20, scale bar: 100 μm).

