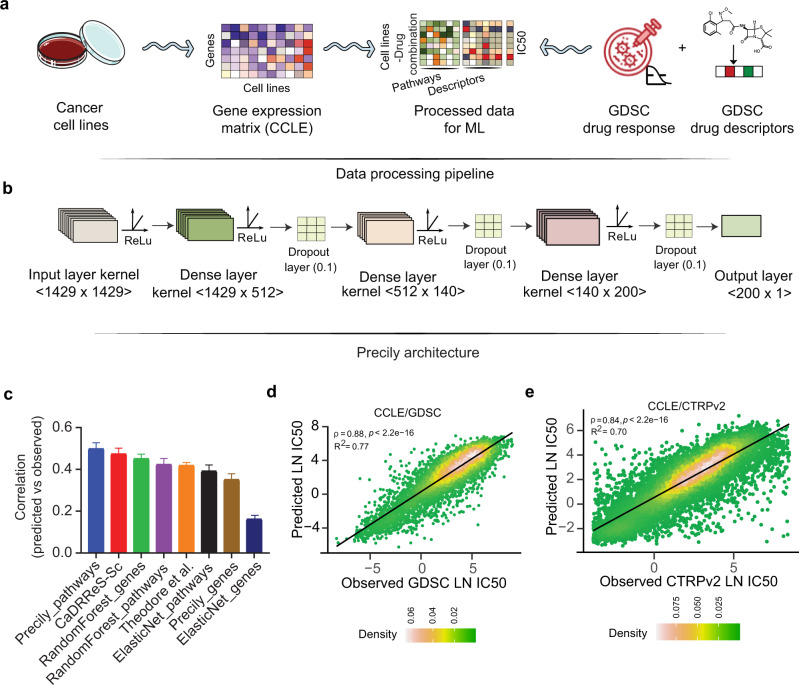
Fig. 1. Illustration of the predictive analysis workflow of Precily.
a Schematic workflow depicting the data processing pipeline of Precily. The first step involved the processing of training data. The RNA-seq gene expression (RSEM TPM) profiles from Cancer Cell Line Encyclopedia (CCLE) were subjected to pathway score transformation using GSVA. This GSVA score matrix was integrated with the drug descriptors obtained in the form of SMILES embedding for each compound. b Model architecture. The second step was the training of the ML model on this data, comprising GSVA scores and drug descriptors as an explanatory variable set and natural log-transformed IC50 values sourced from the GDSC database as the response variable. A deep neural network (DNN) from the Keras platform was used to perform the regression task of predicting drug response. c Comparison of drug response prediction across different approaches. Barplot shows the distribution of Pearson’s correlation coefficients for predicted vs. observed LN IC50 values for individual drugs (n = 173). Data are presented as mean values + /− SEM (Standard Error of the Mean). d Scatter plot demonstrating the performance of Precily across all cell line-drug pairs in the CCLE/GDSC test data. P-value was calculated using a two-sided t-test. e Scatter plot demonstrating the performance of Precily across all cell line-drug pairs in the CCLE/CTRPv2 test data. P-value was calculated using a two-sided t-test. Source data are provided in the Source Data file.

