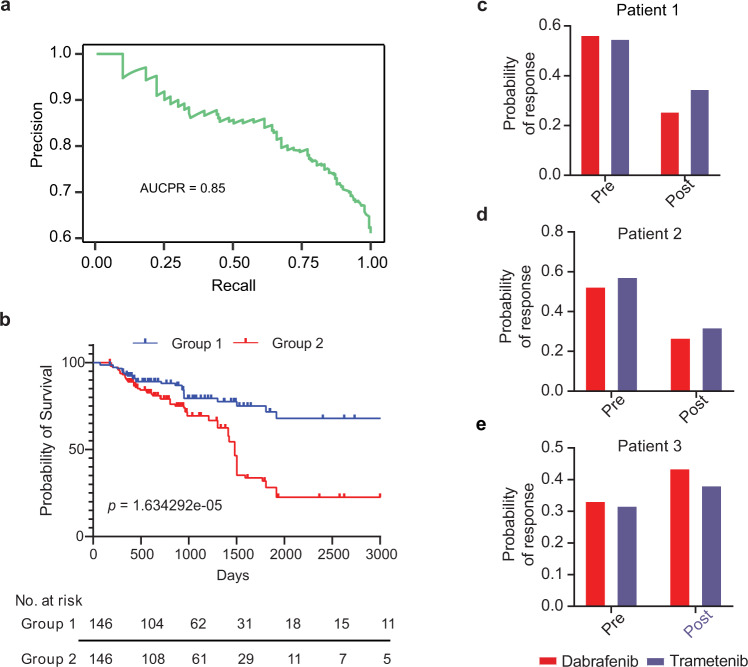
Fig. 5. Evaluation of TCGA model efficiency.
a Precision-recall curve representing the performance of the best AutoML model on the TCGA test dataset. b Survival analysis of a test dataset spanning multiple TCGA cancer types. Patients were classified into two groups based on the median value of the predicted probability of response with a P-value = 1.634292e-05 (log-rank test). We estimated the 5-years survival probability of group 1 as 0.72 and group 2 as 0.28. c–e Bar plots showing the probability of predicted response for drugs dabrafenib and trametinib in patient 1, patient 2, and patient 3, respectively. A red bar indicates the probability of response for dabrafenib and a purple bar indicates the probability of response for trametinib. Source data are provided in the Source Data file.

