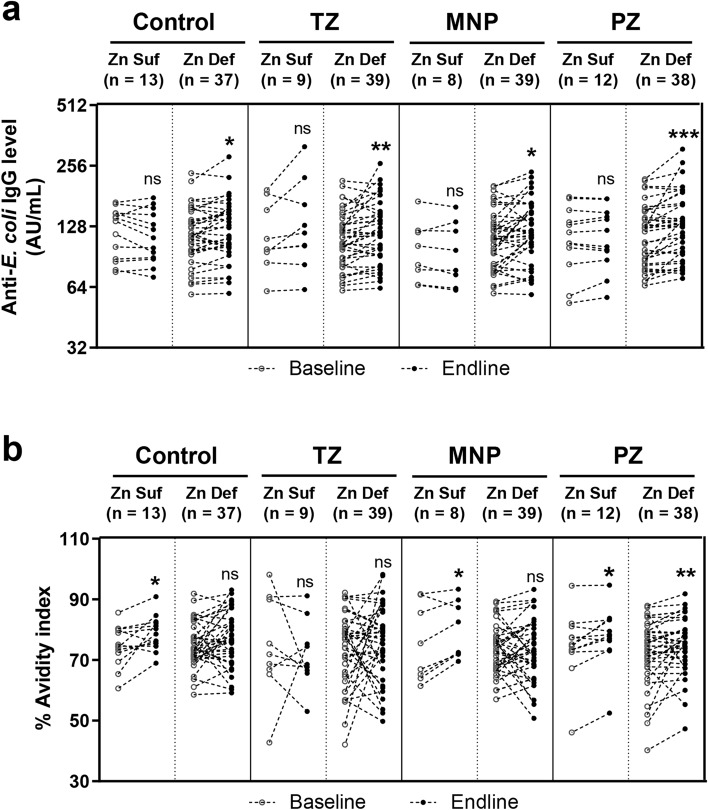
Figure 3.
The plasma IgG level and avidity index of the four intervention groups divided by the baseline zinc status. For each group, the (a) plasma IgG level and (b) avidity index were divided into zinc-sufficient and zinc-deficient sub-groups (C control; TZ therapeutic zinc with diarrhoea; MNP zinc-containing micronutrient powder; PZ preventive zinc). Children who had baseline plasma zinc lower than 65 μg/dL were categorised in the zinc-deficient sub-group. The sample sizes are indicated above each graph. Each dot represents an individual sample. Zn Suf zinc sufficient group; Zn Def zinc deficient group. The P-values indicate significant differences between baseline and endline of each intervention group determined by the Wilcoxon matched-pairs signed rank test. *P < 0.05; **P < 0.01; ***P < 0.001; ns non-significant.

