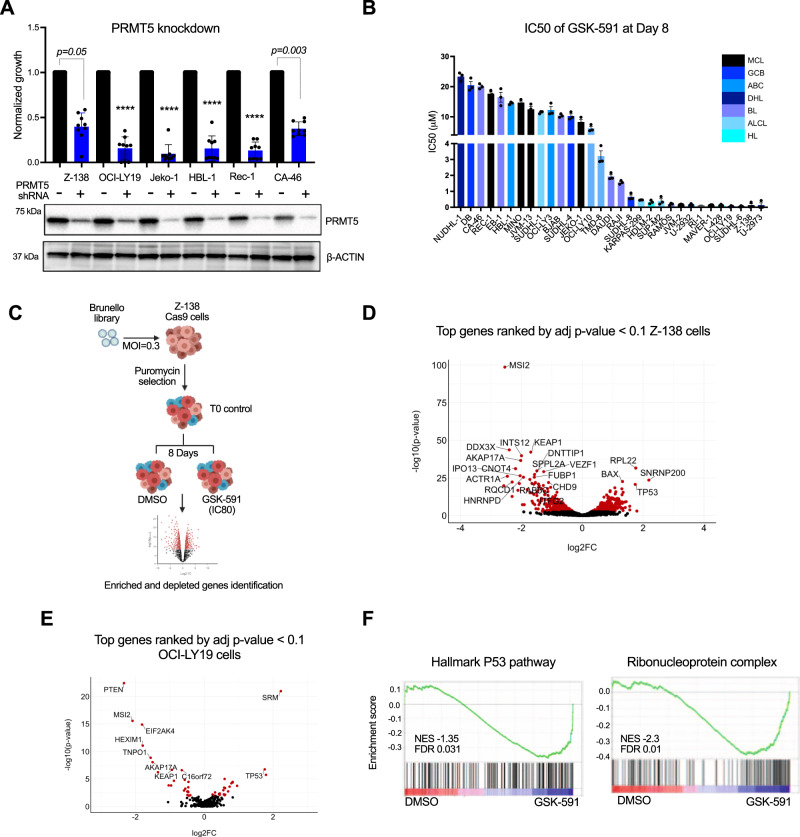
Fig. 1. Genome-wide CRISPR/Cas9 KO screen identified controllers of sensitivity and resistance to PRMT5 inhibition.
A Lymphoma cells were cells transduced with lentivirus expressing shRNA targeting PRMT5 or scramble. Cell viability and immunoblot analysis were assessed 5 days after transduction and puromycin selection. Data represent mean ± SEM of n = 3 replicates examined over 3 independent experiments. p-values are indicated, ****p < 0.0001, statistical analysis by two-sided Student’s t test. B Bar graph showing IC50 values of GSK-591 after 8 days of treatment in 31 lymphoma cell lines from different lymphoma subtypes: Mantle cell lymphoma, Germinal center DLBCL (GCB), Activated B-cell DLBCL (ABC), Double hit lymphoma (DHL), Burkitt’s lymphoma (BL), Anaplastic large cell lymphoma (ALCL) and Hodgkin’s lymphoma (HL). Cell viability was monitored by Celltiter-Glo assay. Error bars represent SEM of triplicate experiments. C Schematic representation of the GSK-591 CRISPR-Cas9 negative screening strategy in Z-138 Cas9 cells. D Volcano plot comparing significance of enrichment/depletion and log2 fold change for all 4 sgRNAs per gene. Red dots represent the genes that were significant depleted and enriched defined by adjust p-value < 0.1 and log2FC < −2 or log2FC > 2. Top 20 hits are annotated. p-values and log2FC were generated using the Wilcoxon-Mann-Whitney test in the CAMERA function. E Validation screen in OCI-LY19 cells: GSK-591 CRISPR-Cas9 negative screening was performed using a customized library (405 genes). Volcano plot showing significantly enriched and depleted genes (red dots). Top 10 hits are annotated. p-values and log2FC were generated using the Wilcoxon-Mann-Whitney test in the CAMERA function. F GSEA analysis showing that P53 pathway and Ribonucleoprotein complex (MSI2 targets) are enriched among the genes that are differentially expressed in GSK-591-resistant cells compared to DMSO-treated cells. The black bars on the x-axis show the genes in the P53-pathway and MSI2-pathway CRISPR ranked list, with Log2fc (DSMO/GSK-591). NES normalized enrichment score. Source data are provided as a Source data file.

