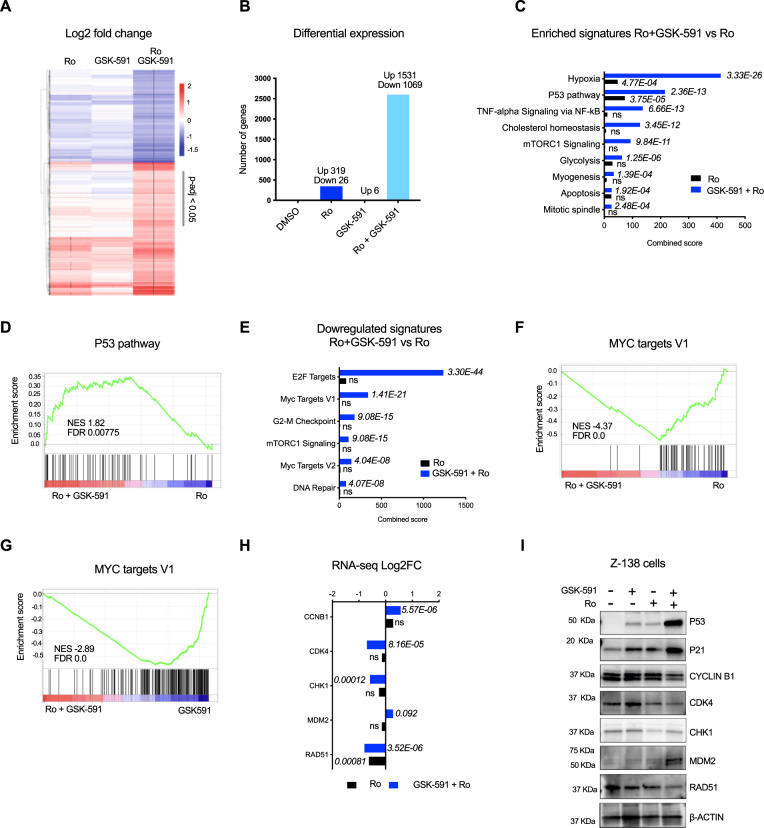
Fig. 4. Combination of Ro and GSK-591 induces synergistic transcriptome changes.
A Heatmap showing differential expression of the top 2600 significantly enriched (in red) and depleted (blue) transcripts in cells treated with 5uM of Ro, GSK-591 alone or in combination for 24 h. Values represent Log2FC, * indicate significant (adjust p-value < 0.05) DESeq genes, determined by one-sided Wilcoxon test. B Bar graph summarizing the number of significant DESeq genes from A in the indicated conditions. C Top significant enriched Molecular Signatures (MSigDB) in the upregulated transcripts (1531) upon drug combination vs. Ro alone using ENRICHR analysis. p-values were calculated by Fisher’s exact test. D GSEA analysis of differentially expressed genes upon combination of GSK-591 and Ro. P53 signature was positively enriched in the combination vs Ro alone. E Top significant enriched Molecular Signatures (MSigDB) in the downregulated transcripts (1069) upon drug combination vs. Ro alone using ENRICHR analysis. p-values were calculated by Fisher’s exact test. F, G GSEA analysis of differentially expressed genes upon combination of GSK-591 and Ro. MYC targets V1 signature was negatively enriched in the combination vs Ro or GSK-591 alone, respectively. H mRNA expression of selected cell-cycle regulation genes upon Ro or combination treatment. n = 3 independent experiments; data represented as mean ± SEM, two-sided Student’s t test. I Representative immunoblot analysis of the indicated cell-cycle regulator proteins. Z-138 cells were treated with 5uM of GSK-591 and Ro for 24 h. Beta-actin expression was used as a loading control. Similar abundance was observed in 2 different immunoblots. Source data are provided as a Source data file.

