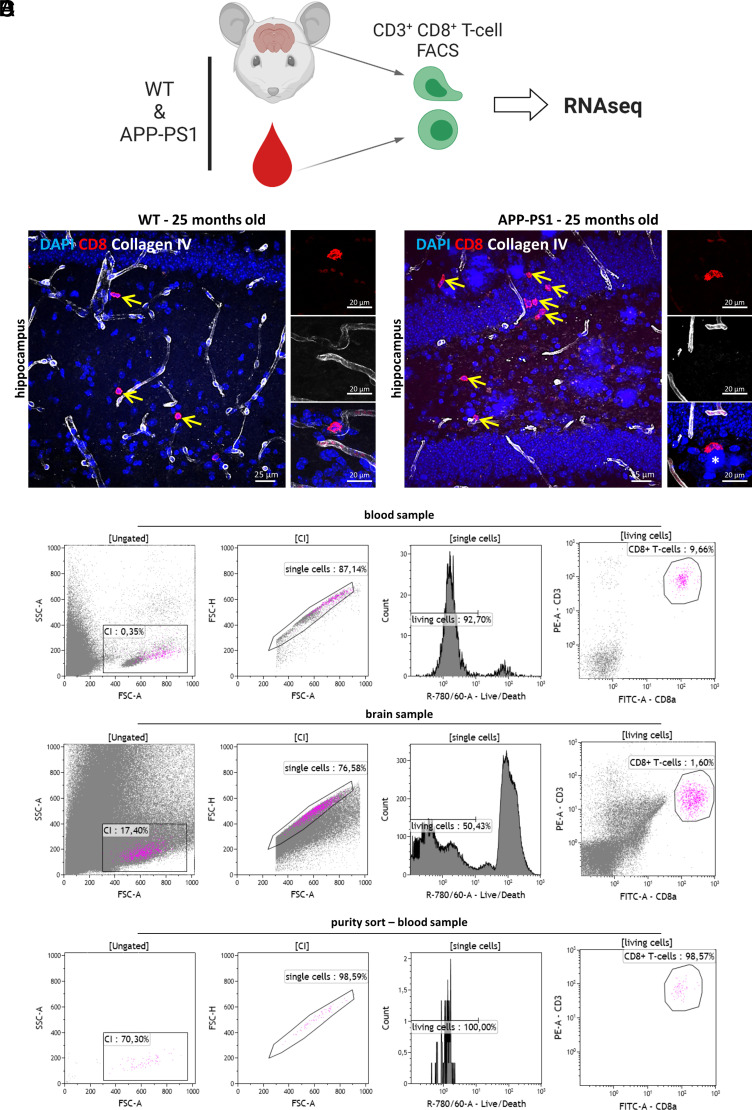
FIGURE 1.
Isolation of blood and brain CD8+ T cells. (A) Experimental setup. CD3+ CD8+ T cells were isolated from the brain and blood of WT and APP-PS1 mice using FACS and subsequently profiled using mRNA-seq analysis. The image was created with BioRender.com. (B and C) Representative immunohistochemistry images of CD8 (red)- and collagen IV (white)–stained hippocampus brain sections of WT (B) and APP-PS1 mice (C). CD8+ T cells were identified directly in the brain parenchyma (yellow arrows). (D) Representative plots of FACS gating strategy: single, living CD3+CD8+ T cells were isolated from the blood and brain homogenates. Sort purity was regularly analyzed. Scale bars, 25 µm (A, B), 20 µm in inserts (A, B).

