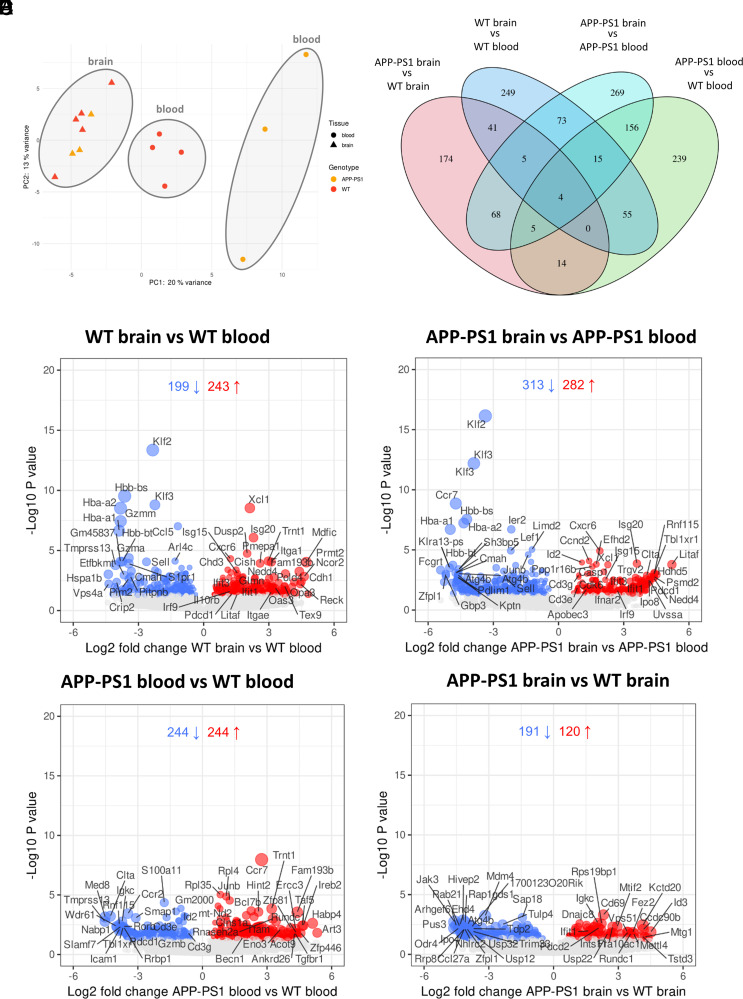
FIGURE 2.
Results of the mRNA-seq analysis from brain- and blood-isolated CD8+ T cells. (A) Principal component analysis of brain and blood samples from WT and APP-PS1 mice (n = 3–5/group). (B) Venn diagram with numbers of significantly regulated genes in all four comparisons. (C–F) Volcano plots showing significantly regulated genes for the comparisons (C) WT brain versus WT blood, (D) APP-PS1 brain versus APP-PS1 blood, (E) APP-PS1 blood versus WT blood, and (F) APP-PS1 brain versus WT brain. Genes with a p value <0.05 were considered as significantly differentially expressed (blue indicates downregulated, red indicates upregulated). PC2, second principal component.

