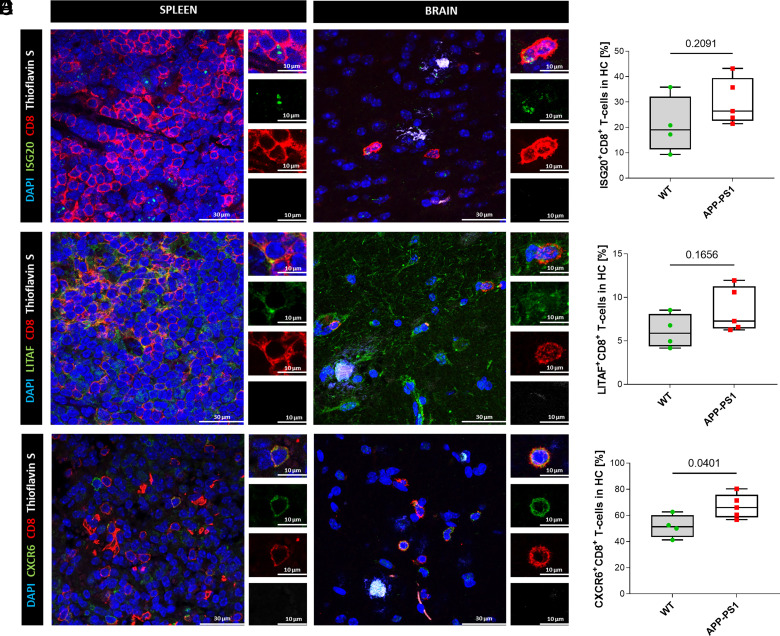
FIGURE 3.
Immunohistochemistry staining and quantitative colocalization analysis of hippocampal CD8+ T cells. (A, C, and E) Representative images of hippocampal CD8+ T cells of APP-PS1 mice. Spleen tissue was used as positive control for Ab stainings. DAPI (blue) was used as a nucleus stain and thioflavin S (white) was used to visualize amyloid plaques. Scale bars, 30 µm, inserts 10 µm. (B, D, and F) Quantitative analysis of ISG20, LITAF, and CXCR6 coexpression on CD8+ T cells in the hippocampal region of WT and APP-PS1 mice (n = 4–5). Statistical differences between two groups were assessed via a Student t test. A p value <0.05 was considered statistically significant.

