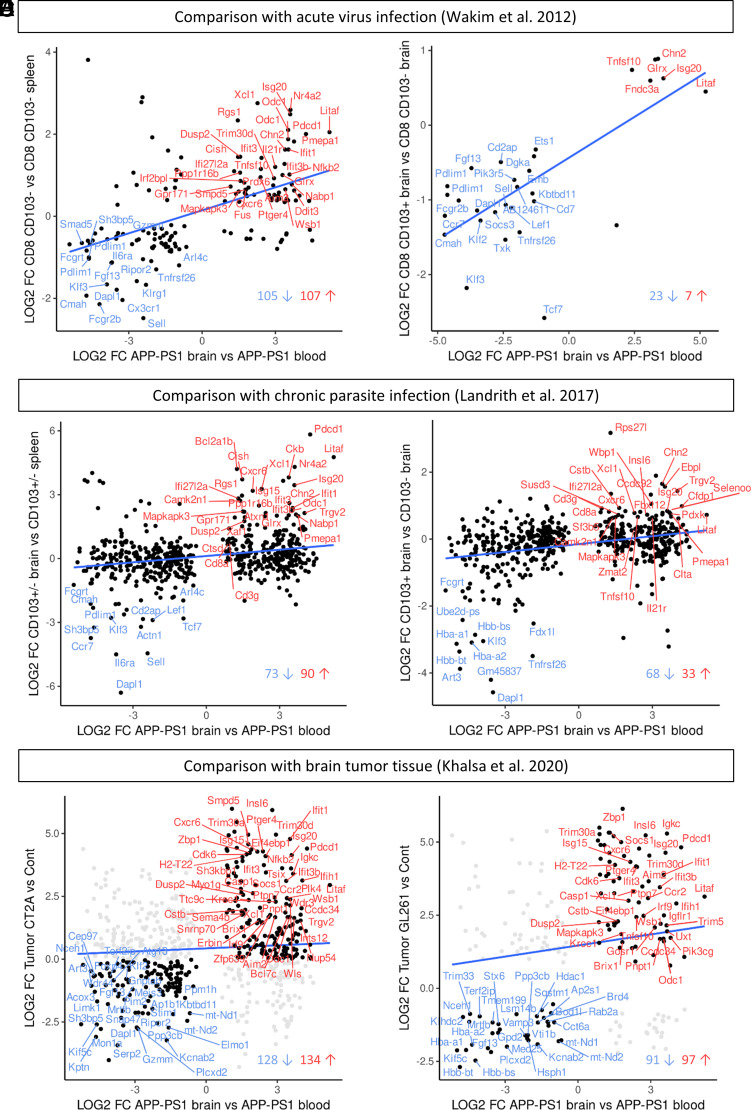
FIGURE 6.
Comparisons with transcriptomic data of different brain inflammation models. (A and B) Comparison with gene microarray data from brain CD8+ T cells of virus-infected mice (Wakim et al. [47]). (A) Significantly DEGs that are shared in APP-PS1 brain CD8+ T cells and brain CD8+ T cells (CD103+ and CD103−) from an acute virus infection mouse model. (B) Significantly DEGs that are shared in APP-PS1 brain CD8+ T cells and brain CD103+ CD8+ Trm T cells from the virus infection mouse model. The overlapping genes belong to the top regulated genes in the Wakim et al. data and included the genes Klf2, Sell, Cxcr6, Isg20, and Litaf. (C and D) Comparison with transcriptomic data of brain CD8+ T cells of a chronic parasite infection mouse model (Landrith et al. [48]). (C) Significantly DEGs that are shared in APP-PS1 brain CD8+ T cells and brain CD8+ T cells (CD103+ and CD103−) from a chronic parasite infection mouse model. (D) Significantly DEGs that are shared in APP-PS1 brain CD8+ T cells and brain CD103+CD8+ Trm T cells from the parasite infection mouse model. The overlapping genes included Klf2, Sell, Litaf, Cxcr6, and Isg20. (E and F) Comparison with the transcriptomic immune profile of brain tumor (glioblastoma) tissue (Khalsa et al. [49]). (E) Shared DEGs between APP-PS1 brain CD8+ T cells and the immunological inert tumor CT2A. (F) Shared DEGs between APP-PS1 brain CD8+ T cells and the immunological more active tumor GL261. The overlapping genes included Pdcd1, Isg20, Litaf, and Cxcr6 for both tumor types.

